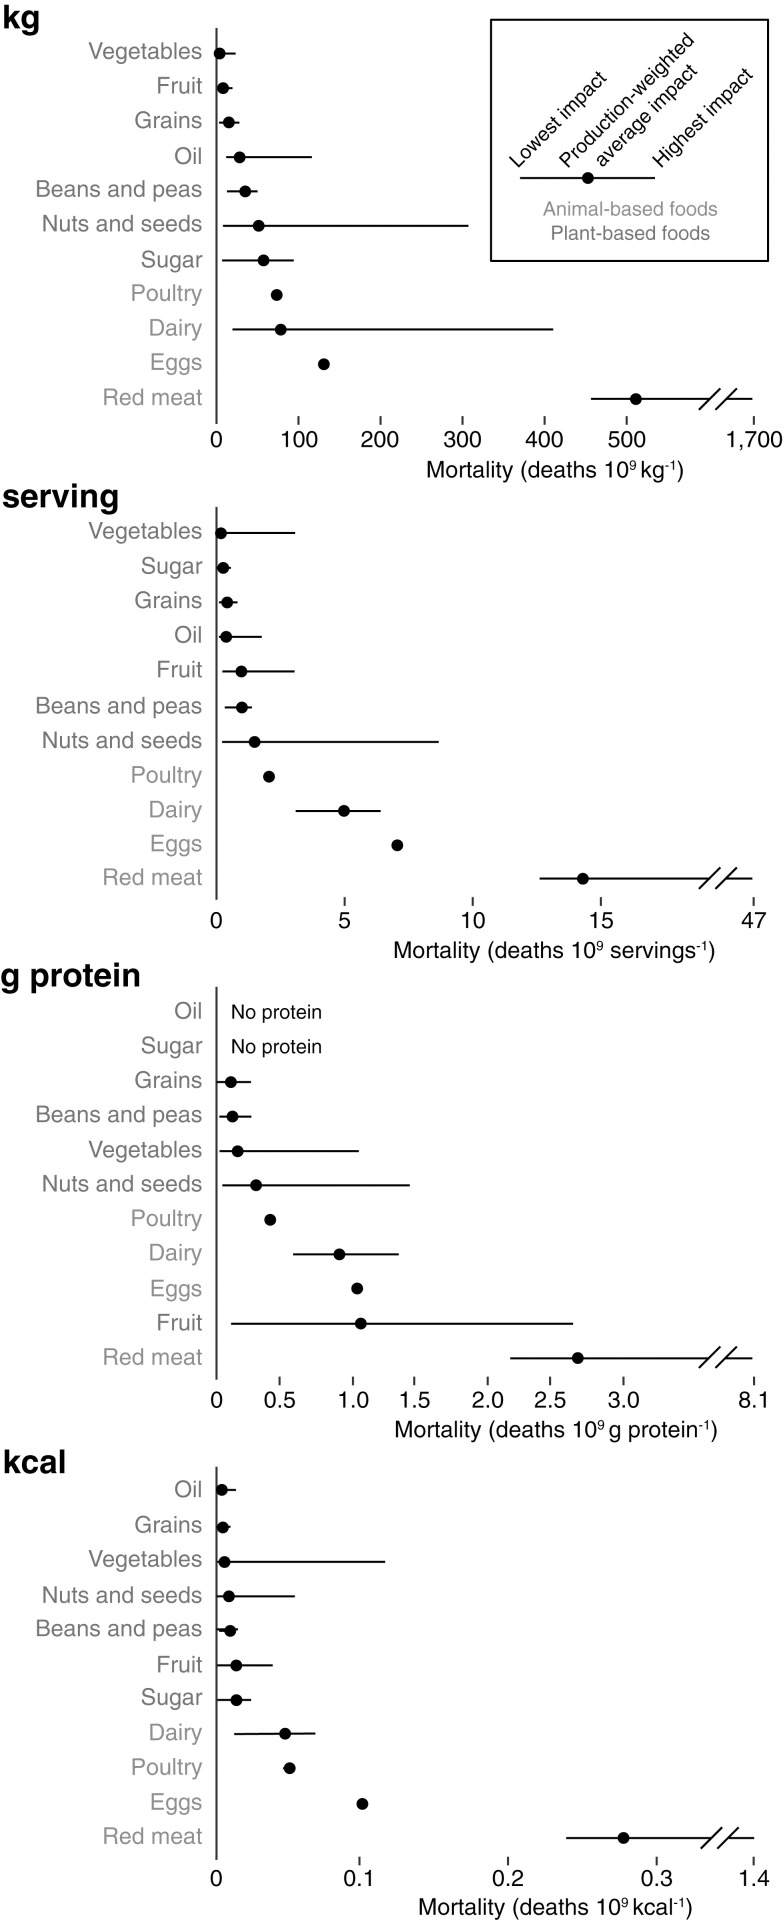
Fig. 3.
Annual premature deaths attributed to total PM2.5 per unit of food production. Annual premature mortality attributed to total PM2.5 per 109 kg, 109 serving, 109 g protein, and 109 kcal, each measured as raw edible portion. Horizontal lines indicate the range of per-unit damages within the food group. Food groups are ordered lowest to highest within each panel.

