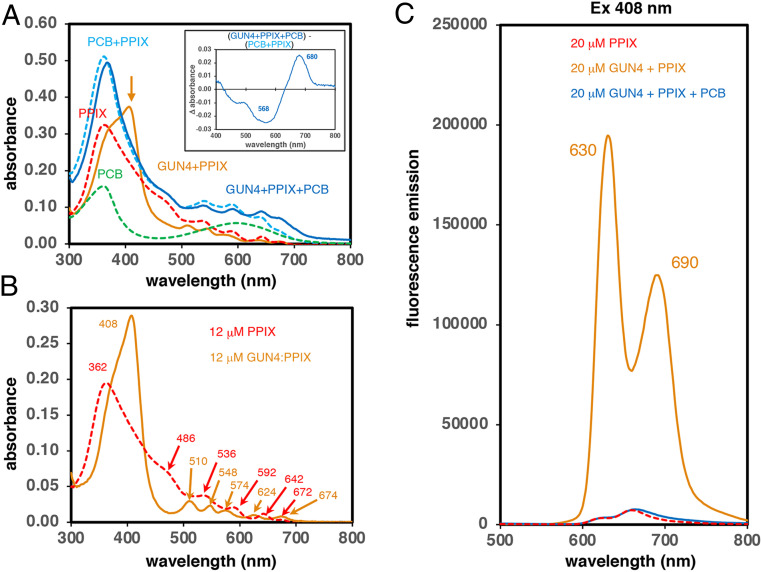
Fig. 2.
PCB addition quenches the strong fluorescence of PPIX adducts of CrGUN4. (A) Absorption spectra of 20 μM free PCB, PPIX, and PCB+PPIX in solution at pH 7.5 are compared with those of binary (CrGUN4+PPIX) and ternary (CrGUN4+PPIX+PCB) mixtures at pH 7.5. Inset shows the difference spectrum constructed by subtracting the spectrum of free PCB+PPIX mixture from that of the ternary (CrGUN4+PPIX+PCB) mixture at pH 7.5. The orange arrow indicates the 408-nm peak in the CrGUN4+PPIX sample. See SI Appendix, Materials and Methods for details. (B) Comparative absorption spectra of 12 μM PPIX and that “calculated” for the CrGUN4:PPIX adduct at pH 7.5 by subtraction of an 8 μM PPIX spectrum from that of 20 μM CrGUN4+PPIX at pH 7.5. Peak wavelengths in nanometers are shown. (C) Comparative fluorescence emission spectra (ex 408 nm) of 20 μM free PPIX, CrGUN4+PPIX and CrGUN4+PPIX+PCB at pH 7.5.

