
Figure 3.
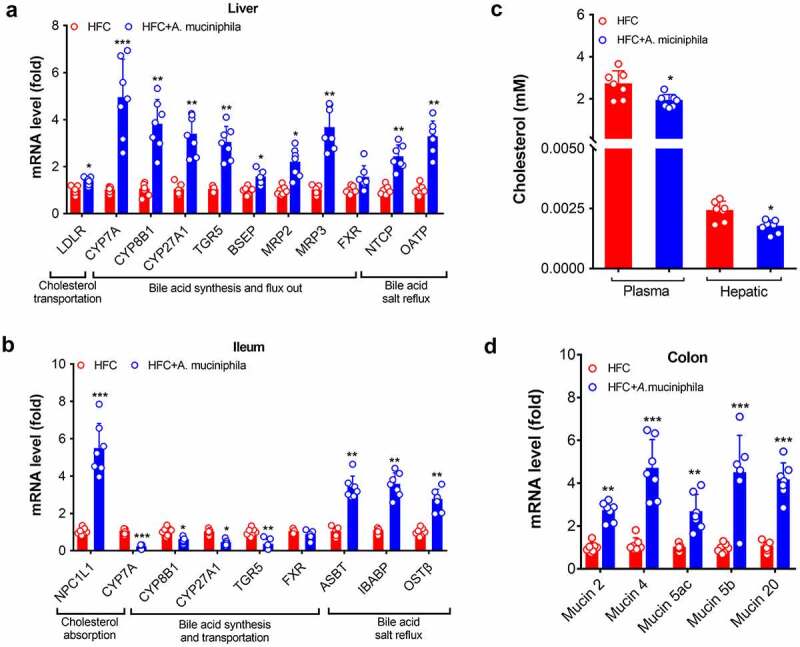
A. muciniphila promoted the metabolism of bile acid in the liver and gut of HFC mice. HFC-induced obese MAFLD (11 weeks of feeding) were administered saline as the control or A. muciniphila (6 weeks of treatment) to assess the liver and ileum parameters. (a) Schematic diagram of bile acid shuttling between the liver and gut. (b) Expression of mRNAs involved in the regulation of the synthesis and transport of bile acids in the liver. (c) Expression of mRNAs involved in the regulation of the synthesis and transport of bile acids in the ileum (d) Plasma level of cholesterol in plasma or the liver. (e) mRNA levels of mucoprotein-related genes in the colon of HFC mice. The level of genes in the HFC control group were set as 1, and the relative fold increases were determined by comparison with the HFC control group. N = 5–8 mice/group. * p < .05, ** p < .01, *** p < .001, compared with the HFC control group mice
revised figure 3