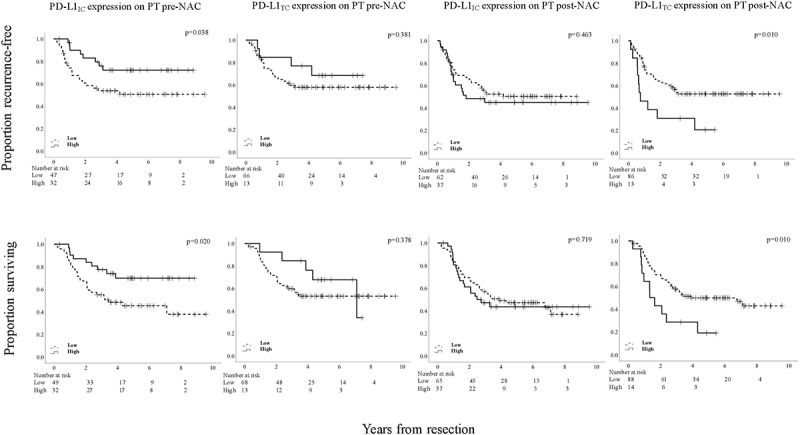
Figure 6.

Kaplan-Meier estimates of TTR and OS in strata according to low and high PD-L1IC and PD-L1TC expression, respectively, in PT pre-NAC and PT post-NAC, in the entire cohort, using the median value as cutoff. Prognostic cutoff points based on the median values were as follows; PT pre-NAC: high PD-L1IC >1%, high PD-L1TC > 0%. PT post-NAC: high PD-L1IC >0%, high PD-L1TC > 0%
