
Figure 7.
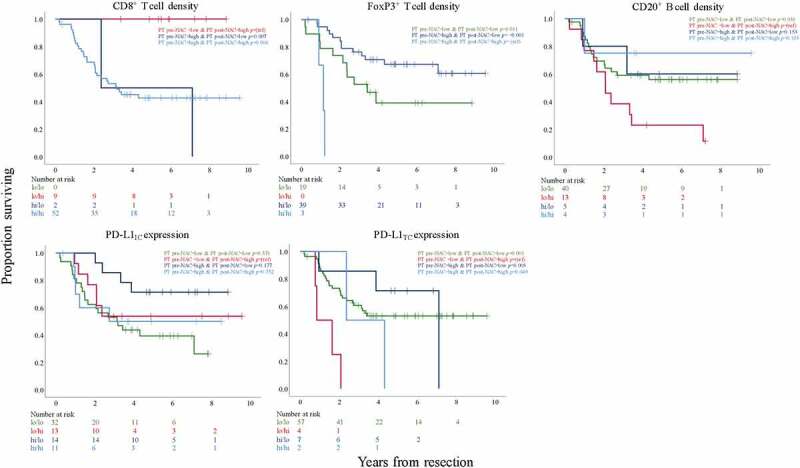
Kaplan-Meier estimates of OS in strata, in the entire cohort, with conversion-variables according to combinations of low or high CD8+, FoxP3+ and CD20+ cell density, respectively, in PT pre-NAC and PT post-NAC and low or high PD-L1IC and PD-L1TC expression, respectively, in PT pre-NAC and PT post-NAC. Prognostic cutoff points are defined by CRT analyses for CD8+, FoxP3+ and CD20+ cells and the median values for PD-L1IC and PD-L1TC expression