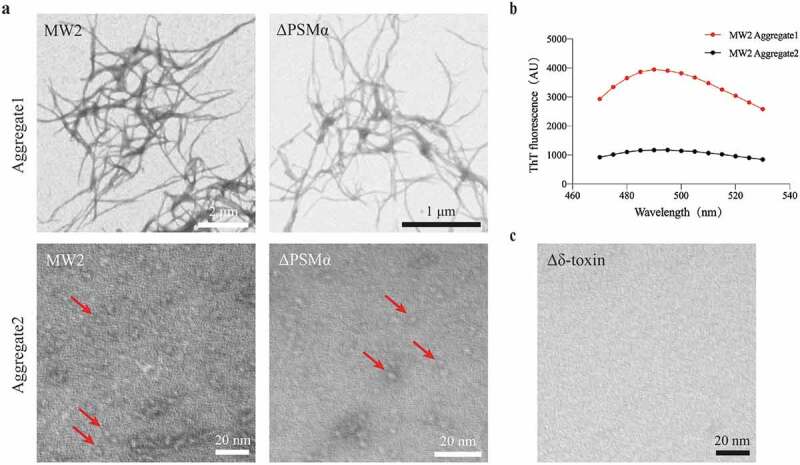
Figure 2.

TEM micrographs of PSM aggregates. (a) TEM micrographs of MW2 and ΔPSMα aggregates. The image scale has been marked in bar length in the lower right corner of the image. Arrows (red) in the images point to the locations of oligomers. (b) MW2 Aggregate1 displays a marked ThT fluorescence peak around 490 nm as compared with the fluorescence peak of MW2 Aggregate2. (c) TEM micrographs of Δδ-toxin do not display any attributes characteristic of aggregates. Experiments in (a-c) were repeated independently three times with similar results
