Figure 5.

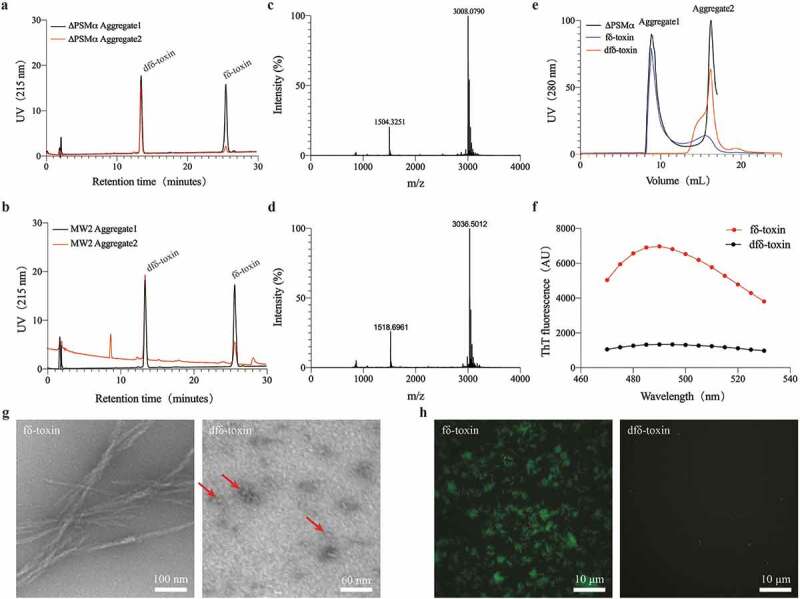
The two aggregates are mainly composed of different δ-toxins. (a, b) HPLC analyzation of MW2 and ΔPSMα, respectively. The labeling of the components is derived from the MALDI identification results. (c-d) MALDI-TOF-MS identifies the results of HPLC peaks. (c) The identification results of HPLC peaks with a retension time of ~14 min. The MW of dfδ-toxin is ~3008 Da. (d) The identification result of HPLC peaks corresponding to a retention time of ~26 min. The MW of fδ-toxin is ~3036 Da. (e) UV (280 nm) absorption curve of two δ-toxins in SEC analysis compared to ΔPSMα. (g) TEM micrographs of two δ-toxins. Image scale bars are included in the lower right corner of the images. The arrows (red) in the images point to the locations of oligomers. (f, h) Thioflavin T (ThT) fluorescence curve and images of two δ-toxins, respectively. In (h), image scale bars are located in the lower right corner of the images. All the experiments were repeated independently three times with similar results
