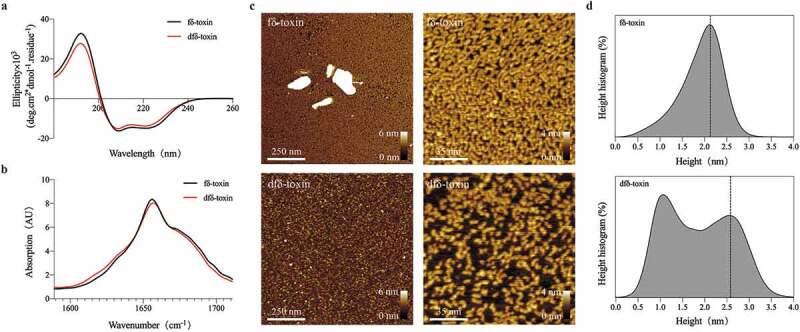
Figure 7.

The state of two δ-toxins in aqueous solution. (a) Circular dichroism (CD) measurement of two δ-toxins at room temperature. Both δ-toxins show the characteristic curve of an α-helix, as determined by CDNN software. Measurements were performed in triplicate and the resulting scans were averaged, smoothed, and the buffer signal was subtracted. (b) MMS measurement of two δ-toxins at room temperature. The bands between 1654 and 1658 cm−1 is consistent with the dominant α-helix [64]. Measurements were performed in triplicate and the resulting scans were averaged, smoothed, and the buffer signal was subtracted. (c) AFM visualization of two δ-toxin aggregates. The image and height scales are marked in the images. (d) The curve shows the height statistics of the two δ-toxin aggregates, as computed using the visualization program Gwyddion. All the experiments were repeated independently three times with similar results
