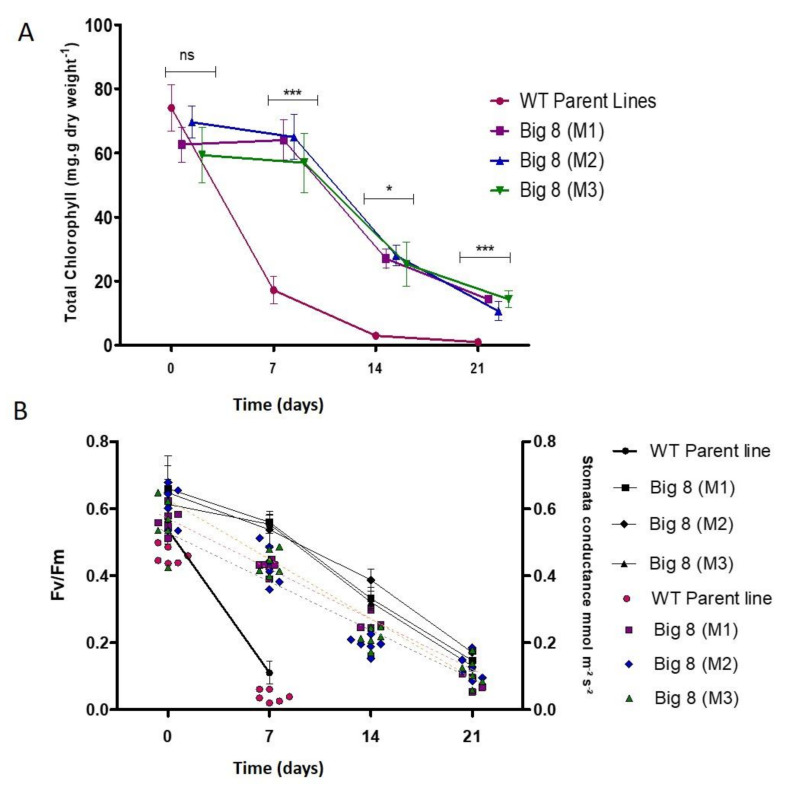
Figure 4.
(A) Changes in total chlorophyll content in WT BIG8 and mutant BIG8-1 plants under well-watered (Day 0) and after exposure to water deficit stress conditions (Day 7, 14, 21 PWS). Each bar represents the mean ± SD of three replications. Asterisks indicate statistically significant differences between WT BIG8 and mutant BIG8-1 plants under similar conditions * p ≤ 0.05. *** p ≤ 0.01 and ns refers to non-significance(B) Changes in the rate of PSII efficiency (Fv/Fm) (line graph), and stomatal conductivity (scatter plot) in the WT BIG8 and mutant BIG8-1 plants under well-watered (Day 0) and after exposure to water deficit stress conditions (Day 7, 14, 21 PWS).

