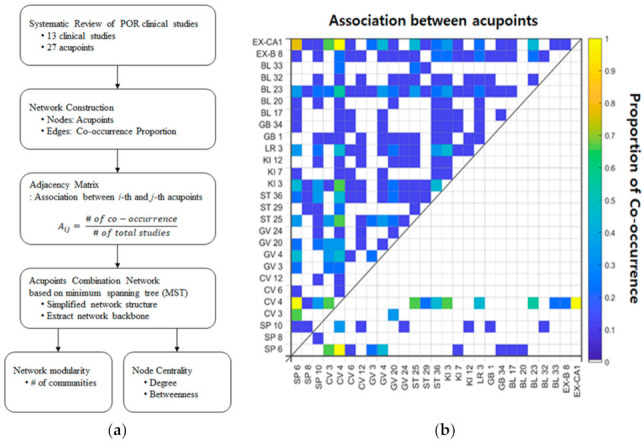
Figure 1.

Network construction and adjacency matrix. (a) The procedure of network analysis involving the proportion of co-occurrence between acupoints revealed by previous clinical studies; (b) The association between acupoints is computed based on the proportion of co-occurrence between two acupoints, and the value is represented in the upper triangular part of the adjacency matrix. In the lower triangular part of the adjacency matrix, the value indicates the proportion of co-occurrence between two acupoints that survived as a result of the application of the minimum spanning tree algorithm. POR, poor ovarian response.
