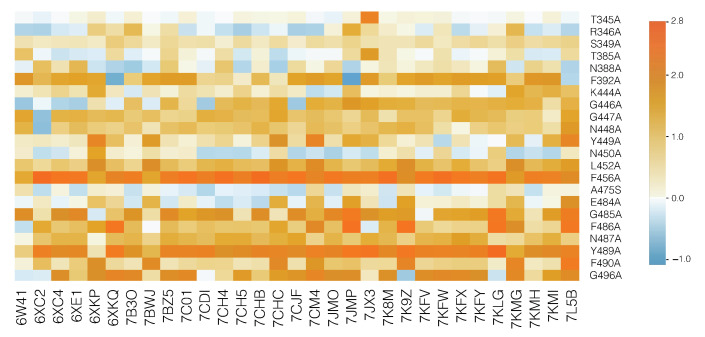
Figure 4.
HeatMap of the predicted values for each of the 31 nAb/spike protein complexes from the set . The color scale is shown on the right (in kcal/mol). Light blue corresponds to variants that slightly stabilize the complex and orange, to mutations that destabilize the complex. The most destabilizing mutations are likely to lead the virus to escape from the immune system.

