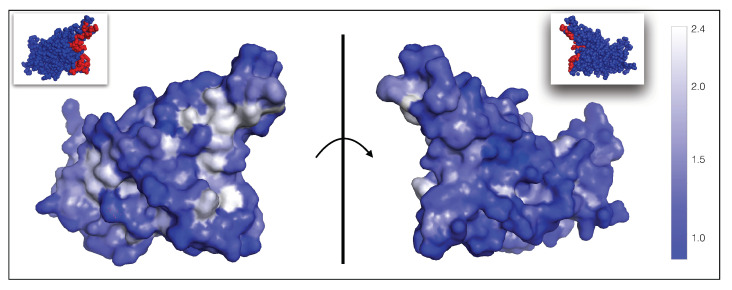
Figure 5.
Average per-residue fitness contributions related to the ability of the virus to escape from the immune system, mapped onto the 3D structure of the spike protein RBD (PDB code 6M0J). As shown in the color bar on the right, residues whose mutation lead to highest average and thus to viral escape from nAbs are shown in white; residues with fitness values of one or lower and not allowing viral escape are in dark blue. The fitness values for all residues in the RBD are given in our GitHub repository (https://github.com/3BioCompBio/SpikeProSARS-CoV-2/blob/main/phi_nAb.dat, accessed on 10 April 2021). The ACE2 binding interface is shown in red in the two small pictures at the top (see also Figure 1). The left and right pictures are related by a 180 rotation with respect to the vertical plane (shown as a line) representing the ACE2 binding interface.

