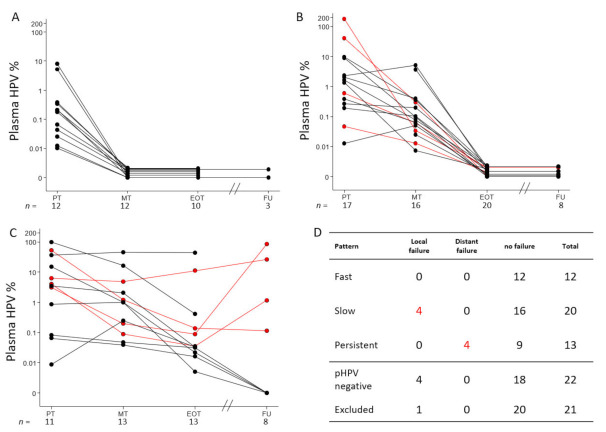
Figure 3.
Elimination patterns of pHPV. Patients with measurable pHPV during treatment were divided into three groups. (A) 12 patients with a fast pHPV elimination pattern. (B) 20 patients with slow pHPV elimination pattern. (C) 13 patients with molecular persistent disease. In (D), the relation between the pattern and treatment outcome are outlined, including 22 patients with undetectable pHPV and the 21 patients who were excluded due to insufficient repeated pHPV measurements. Highly significant differences were detected between all patterns, Fishers exact p < 0.01. Red lines represent patients with treatment failure. X-axis show sample collection time: Prior to treatment (PT), Mid treatment (MT), End of treatment (EOT) and at one to three years follow up (FU). Y-axis measure the level of plasma HPV in percent of total DNA level. Horizontal lines with a pHPV value of zero are separated to illustrate the progression of each case, and sample size (n) is measured below each time point.

