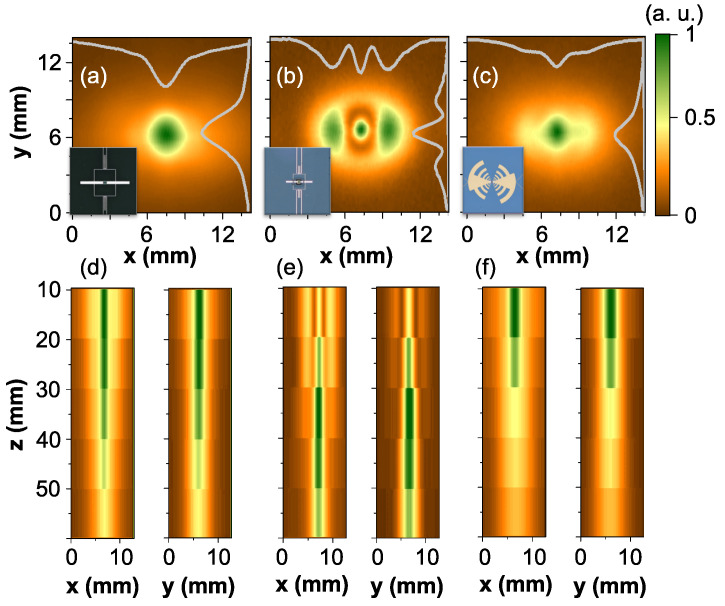
Figure 3.
The radiation patterns measured with different Ti-bolometers placed at mm position: Panel (a)—0.3 THz bolometer; panel (b)—0.7 THz Ti-bolometer, panel (c)—wideband Ti-bolometer. Grey lines indicate intensity center cross-sections along the relevant axes. Note particular spatial mode profiles clearly resolved by different antenna-coupled Ti-bolometers. Panels (d–f) depict and scans from 10 mm to 50 mm along z direction for 0.3 THz, 0.7 THz and wideband Ti-bolometers, respectively.

