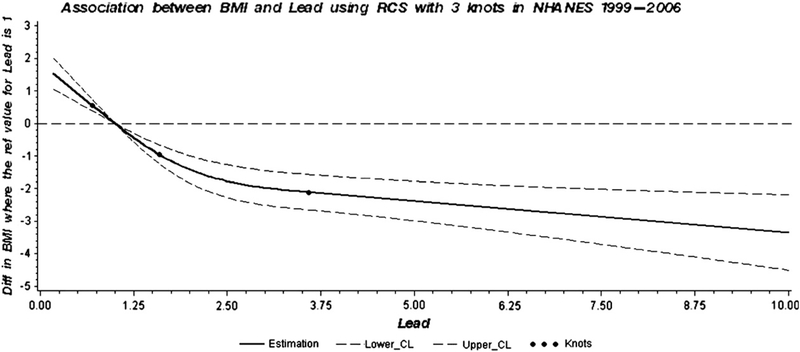
Fig. 2.
Dose–response association between BMI and blood lead in adults adjusted for race/ethnicity, gender, age, hematocrit, smoking status, serum cotinine, alcohol consumption, education, calorie intake and moderate and vigorous activity covariates. A solid line shows dose–response curve between blood lead and BMI in NHANES 1999–2006. Y-axis represents the difference in BMI between individuals with any value of blood lead with individuals with 1.0 μg/dL of blood lead. The dashed lines represent the 95% confidence of interval. Knots are represented by dots.

