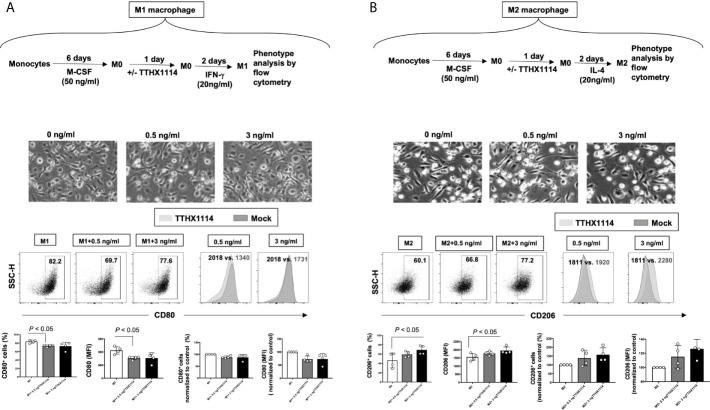
Figure 7.
Effect of FGF-1 on M1 and M2 polarization from human monocyte-derived macrophages: Unpolarized M0 macrophages were generated from M-CSF-treated primary monocytes and treated with FGF-1 (0.5 and 3 ng/ml) for 24 hr. M1- and M2-polarized macrophages were then generated by stimulation with IFN-g and IL-4, respectively. (A) Experimental plan as shown (top panel). Representative images of M1 and M2 macrophages treated with FGF-1 (0.5 and 3 ng/ml). CD80 and CD64 levels in M1 macrophages treated with FGF-1 were compared by flow cytometry. Dot plots and histograms depict the results obtained in one representative donor; the grey histogram represent mock treated M1 macrophage, and the blue histogram represent the fluorescent profile of FGF-1 treated M1 macrophage stained with the indicated antibodies; the percentage and MFI (mean fluorescence intensity) of positive cells is indicated. The graph (lower panel) represents mean results from at least three different donors. (B) Experimental plan as shown (top panel). CD163 and CD206 levels in M2 macrophages treated with FGF-1 were compared by flow cytometry. Dot plots and histograms depict the results obtained in one representative donor; the grey histogram represent mock treated M2 macrophage, and the blue histogram represent the fluorescent profile of FGF-1 treated M2 macrophage stained with the indicated antibodies; the percentage and MFI (mean fluorescence intensity) of positive cells is indicated. The graph (lower panel) represents mean results from at least four different donors.

