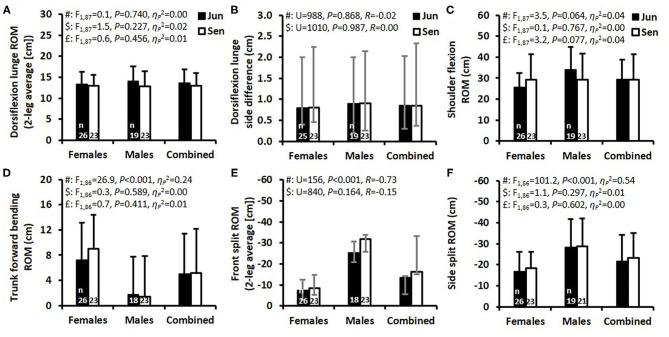
Figure 3.
Flexibility test results presented as mean ± standard deviation (SD) (A,C,D,F) and as median and interquartile range (B,E) for the junior (Jun) and senior (Sen) female and male athletes and the combined group of female and male athletes. Abbreviations: ROM, range of motion; Hg, Hedges' g effect size. F-values, P-values, and partial eta squared effect size (), were obtained by a two-way ANOVA. #Main effect of sex. $Main effect of age group. £Main effect for interaction between sex and age group. In (B,E), P-values were obtained by a Mann-Whitney U-test presented together with an R effect size. The numbers located at the bottom of each of the four bars indicate the number of participants (n) in the specific test.

