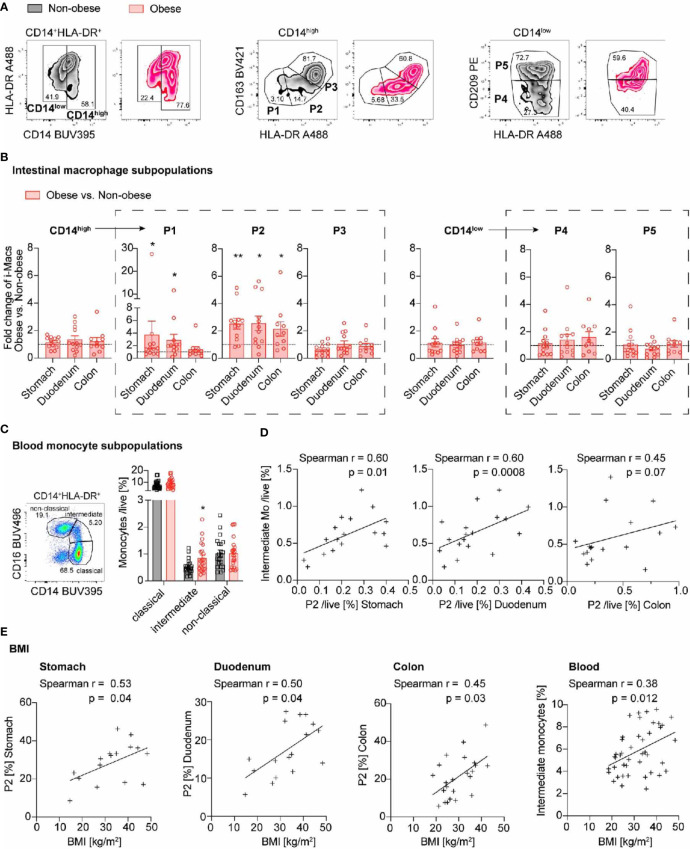
Figure 3.
Pro-inflammatory macrophages increase throughout the gastrointestinal tract in obese individuals and are accompanied by higher intermediate blood monocytes. (A) Representative flow cytometry plots identifying intestinal macrophages subpopulations in non-obese (black) and obese (red) individuals. CD14high represent pro-inflammatory P1, P2 and intermediate P3 subpopulations and CD14low anti-inflammatory/resident P4, P5 subpopulations. (B) Fold change of intestinal macrophage subpopulations comparing obese (n = 10-12) to non-obese (n = 12-13) subjects along the gastrointestinal tract. (C) Frequency of classical, intermediate, and non-classical blood monocytes in non-obese (black; n = 22) and obese (red; n = 25) subjects. (D) Spearman correlation between intestinal macrophage subpopulation P2 in stomach, duodenum or colon and intermediate blood monocytes. (E) Spearman correlation of intestinal macrophage subpopulation P2 in stomach, duodenum, and colon transversum or intermediate blood monocytes with BMI. One data point represents one subject. Statistical data are expressed as mean ± SEM. * p <0.05. ** p <0.01, unpaired Mann-Whitney U test with two tailed distribution (B, C). For Spearman correlation analysis, values above Mean + 2SD were excluded (D, E).

