FIGURE 5.
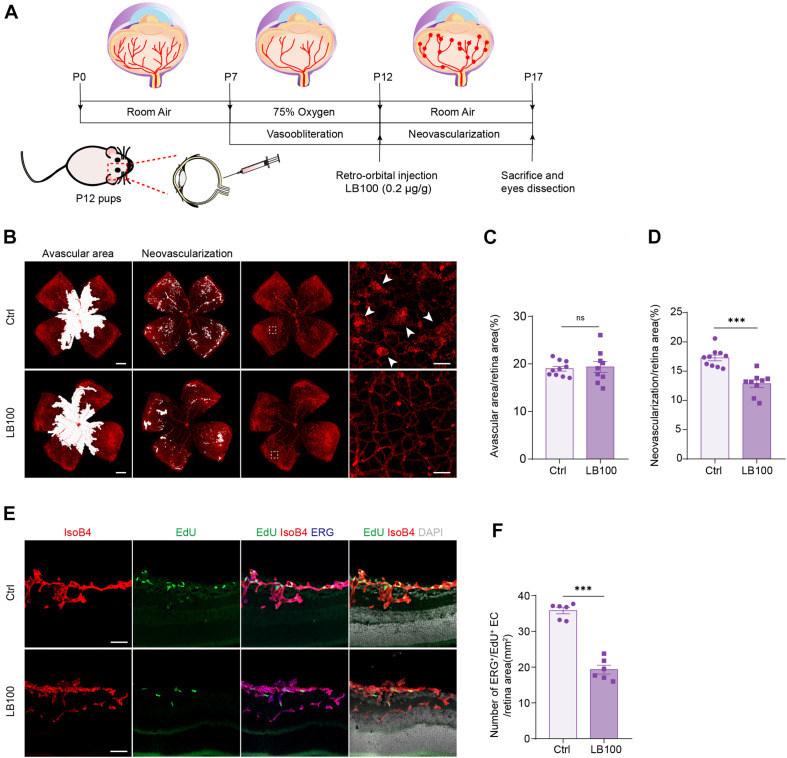
PP2A inhibition suppresses pathological retinal angiogenesis in the OIR model. (A) Schematic depiction of the mouse OIR model. Pups were placed in 75% oxygen from P7 to P12, and then returned to normal oxygen conditions. Vehicle (Ctrl) or LB100 (0.2 μg/g body weight) were injected retro-orbitally at P12. Pups were sacrificed and eyes were dissected at P17. (B) Representative confocal images of retina vasculature stained with IsoB4 in OIR retinas from vehicle (Ctrl) or LB100 treated pups. The avascular area, neovascularization area, and high magnification images for showing the neovascular tufts (indicated by arrowheads) are presented, respectively. (C,D) Avascular area and neovascularization quantification of (B). n = 10 Vehicle and 9 LB100 eyes per condition. (E) Representative confocal images of retina sagittal sections costained with IsoB4, EdU (labels proliferating cells), and ERG (labels EC nuclei) in pups treated as in (A). (F) Quantitative analysis of EdU+ ERG+ cell number of (E). n = 6 Vehicle and 6 LB100 eyes per condition. Data are shown as mean ± SEM, two tailed Student’s t-test. ∗∗∗p < 0.001, ns indicates not significant. Scale bars, 500 μm (lower magnification) and 50 μm (insets) in (B), 50 μm in (E).

