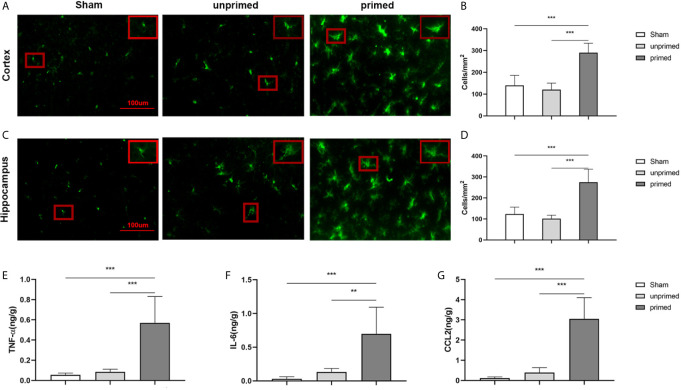
Figure 11.
BAFF induced microglial training in vivo. Immunofluorescence staining of Iba1 in the cortex (A) and hippocampus (C). Comparisons of the numbers of Iba1-positive microglia in the cortex (B) and hippocampus (D) (n = 6). A representative Iba-1+ cell from the cortex is shown magnified in the red box in the image’s right upper corner. The expression of TNF-α (E), IL-6 (F), CCL2 (G) were measured in the supernatants by ELISA on day 7(n = 6). Data are mean ± SEM; Kruskal-Wallis test with Turkey post hoc test; **p < 0.01, and ***p < 0.001.

