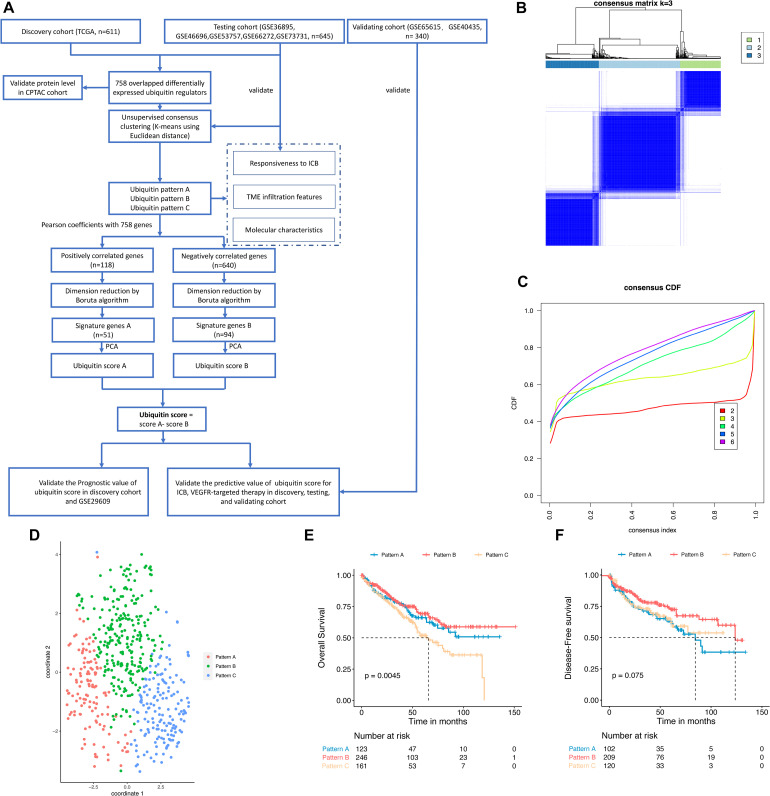
FIGURE 1.
Identification of ubiquitin patterns using unsupervised consensus clustering and prognosis analysis in the discovery cohort. (A) The workflow of this study. (B) K-means clustering using 758 differentially expressed ubiquitin regulators. (C) CDF curve of the clustering result. (D) Validating the discrimination of k = 3 using t-SNE analysis. (E,F) Overall Survival (OS) and Disease-Free Survival (DFS) of the ubiquitin patterns in the TCGA-KIRC dataset. Statistical difference was compared using the log-rank test.

