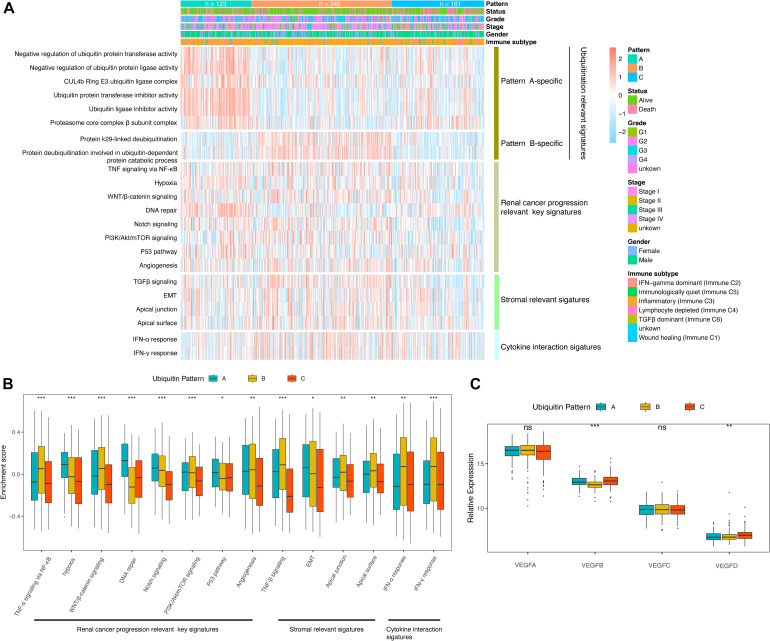
FIGURE 2.
Molecular characteristics of the ubiquitin pattern. (A) Heatmap of the ubiquitin-relevant signature of the subclasses. (B) Boxplot of the GSVA enrichment score of ccRCC progression-relevant signatures. (C) Relative expression of VEGF family distinguished by ubiquitin patterns. The median values of the enrichment scores were compared using the Kruskal–Wallis test. Statistical significance levels were indicated with asterisks above the boxplot (ns, no statistical difference, * p < 0.05, ** p < 0.01, *** p < 0.001).

