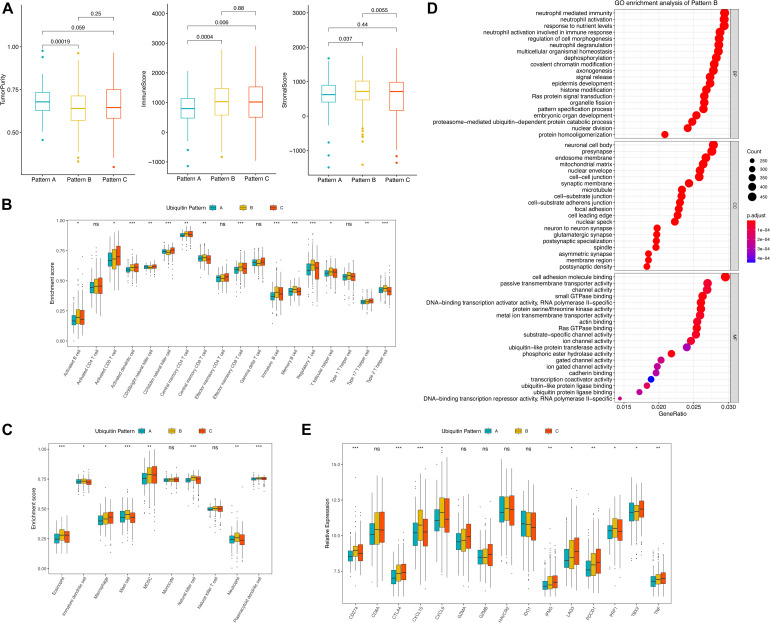
FIGURE 3.
TME features of distinct ubiquitin patterns. (A) Tumor purity, immune score, and the stromal score of the subclasses generated by the “ESTIMATE” algorithm. The comparison was performed by Student’s t-test. (B,C) Estimated abundance of 18 adaptive and 10 innate immune cells using ssGSEA. Inter-subgroup comparison was performed by one-way ANOVA. (D) GO enrichment results of pattern B. The Top 20 of biological process (BP), cellular component (CC), and molecular function (MF) were displayed. (E) Association of ubiquitin patterns with immune checkpoint molecules. Kruskal–Wallis test, ns, no statistical difference, * p < 0.05, ** p < 0.01, *** p < 0.001.

