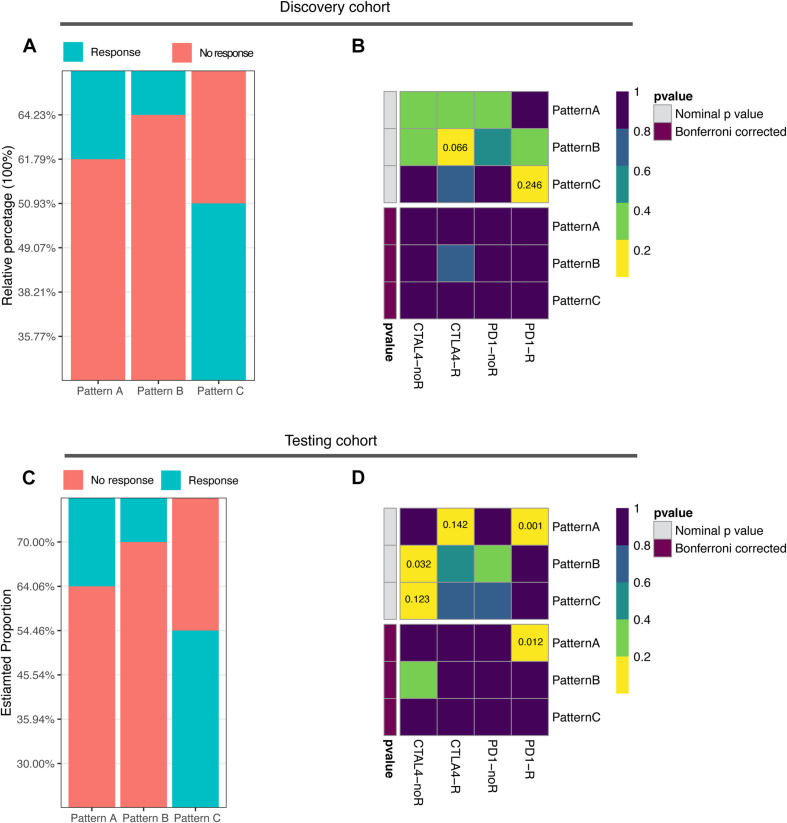
FIGURE 4.
Correlation of ubiquitin patterns with immunotherapy benefit. (A,C) The predicted response rate in TIDE analysis of discovery and testing cohorts. Fisher’s exact test, p = 0.008, p < 0.0001, respectively. (B,D) The similarity of gene expression profiles between ubiquitin patterns and melanoma patients treated with ICB (n = 47). CTLA4-noR, patients no respond to anti-CTLA4 treatment, CTLA4-R, patients respond to anti-CTLA4 treatment, PD1-noR, patients no respond to anti-PD1 treatment, PD1-R, patients respond to anti-PD1 treatment.

