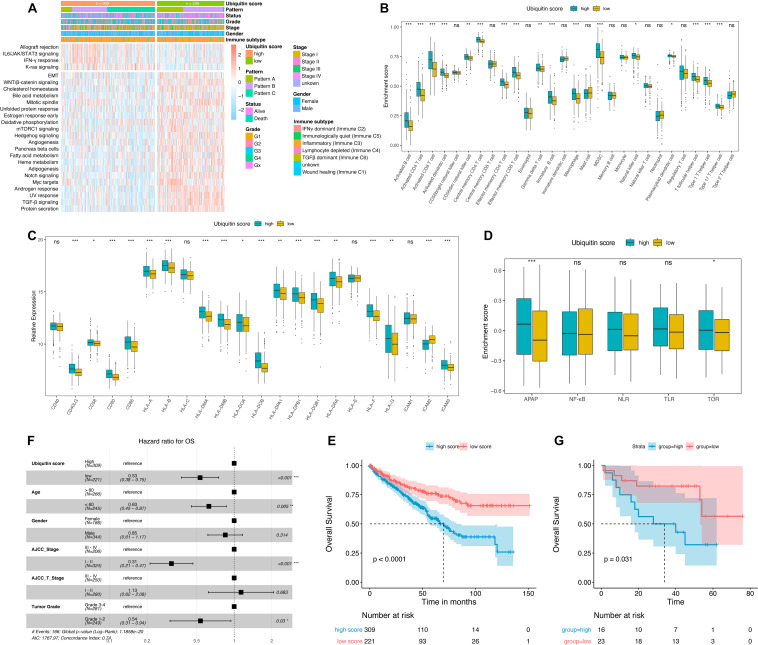
FIGURE 5.
Characterization the ubiquitin score groups and prognosis analysis. (A) Hallmark pathways of ubiquitin score group determined by GSVA enrichment, | logFC| > 0.1. (B) Immune infiltration landscape, Wilcoxon test. (C) Relative expression of MHC molecules, co-stimulatory molecules, and adhesion factors, Wilcoxon test. (D) Enrichment scores of immune activation-related signatures, Wilcoxon test. APAP, antigen processing and presenting, NLR, NOD-like receptor signaling pathway, TLR, Toll-like receptor signaling pathway, TCR, T-cell receptor signaling pathway. (E,G) Kaplan-Meier curves of overall survival (OS) in TCGA (E) and GSE29609 (G) cohorts, Log-rank test. (F) Multivariate cox analysis adjusted by age, gender, tumor stage, T-stage, and tumor grade showed that ubiquitin score was an independent risk factor for OS. *p < 0.05, **p < 0.01, ***p < 0.001.

