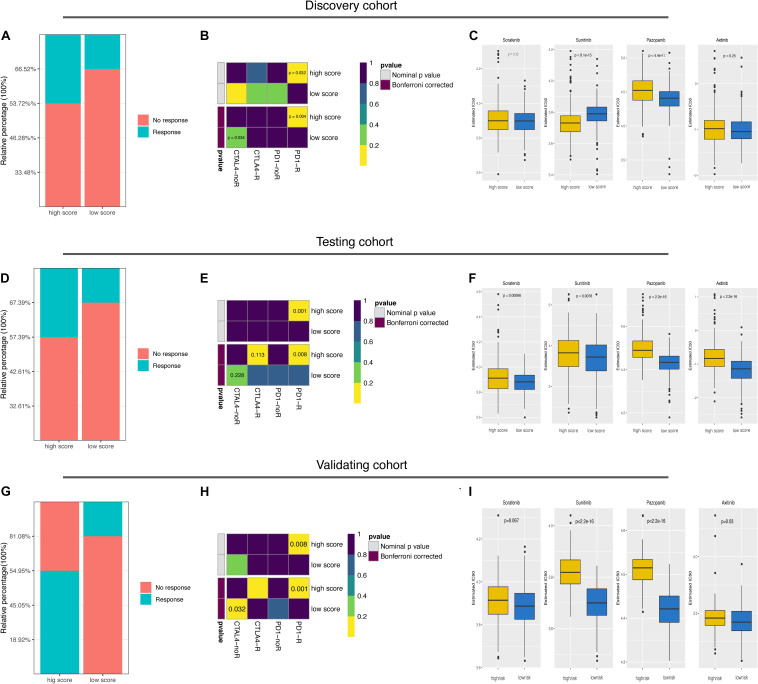
FIGURE 6.
Predictive value of ubiquitin score for immunotherapy and targeted therapies. (A,D,G) The predicted response rate in TIDE analysis of the discovery, testing, and external validating datasets. Fisher exact test, p = 0.003, p = 0.034, p = 3.71e-08, respectively. (B,E,H) Subclass mapping results indicated that the high score group was more likely to respond to anti-PD-1 treatment (Bonferroni corrected p-value = 0.004, 0.008, 0.001, respectively). (C,F,I) Boxplots of the estimated IC50 values for Sorafenib, Sunitinib, Pazopanib, and Axitinib in the three cohorts, Wilcoxon test.

