
Figure 4. A threshold model for DCM.
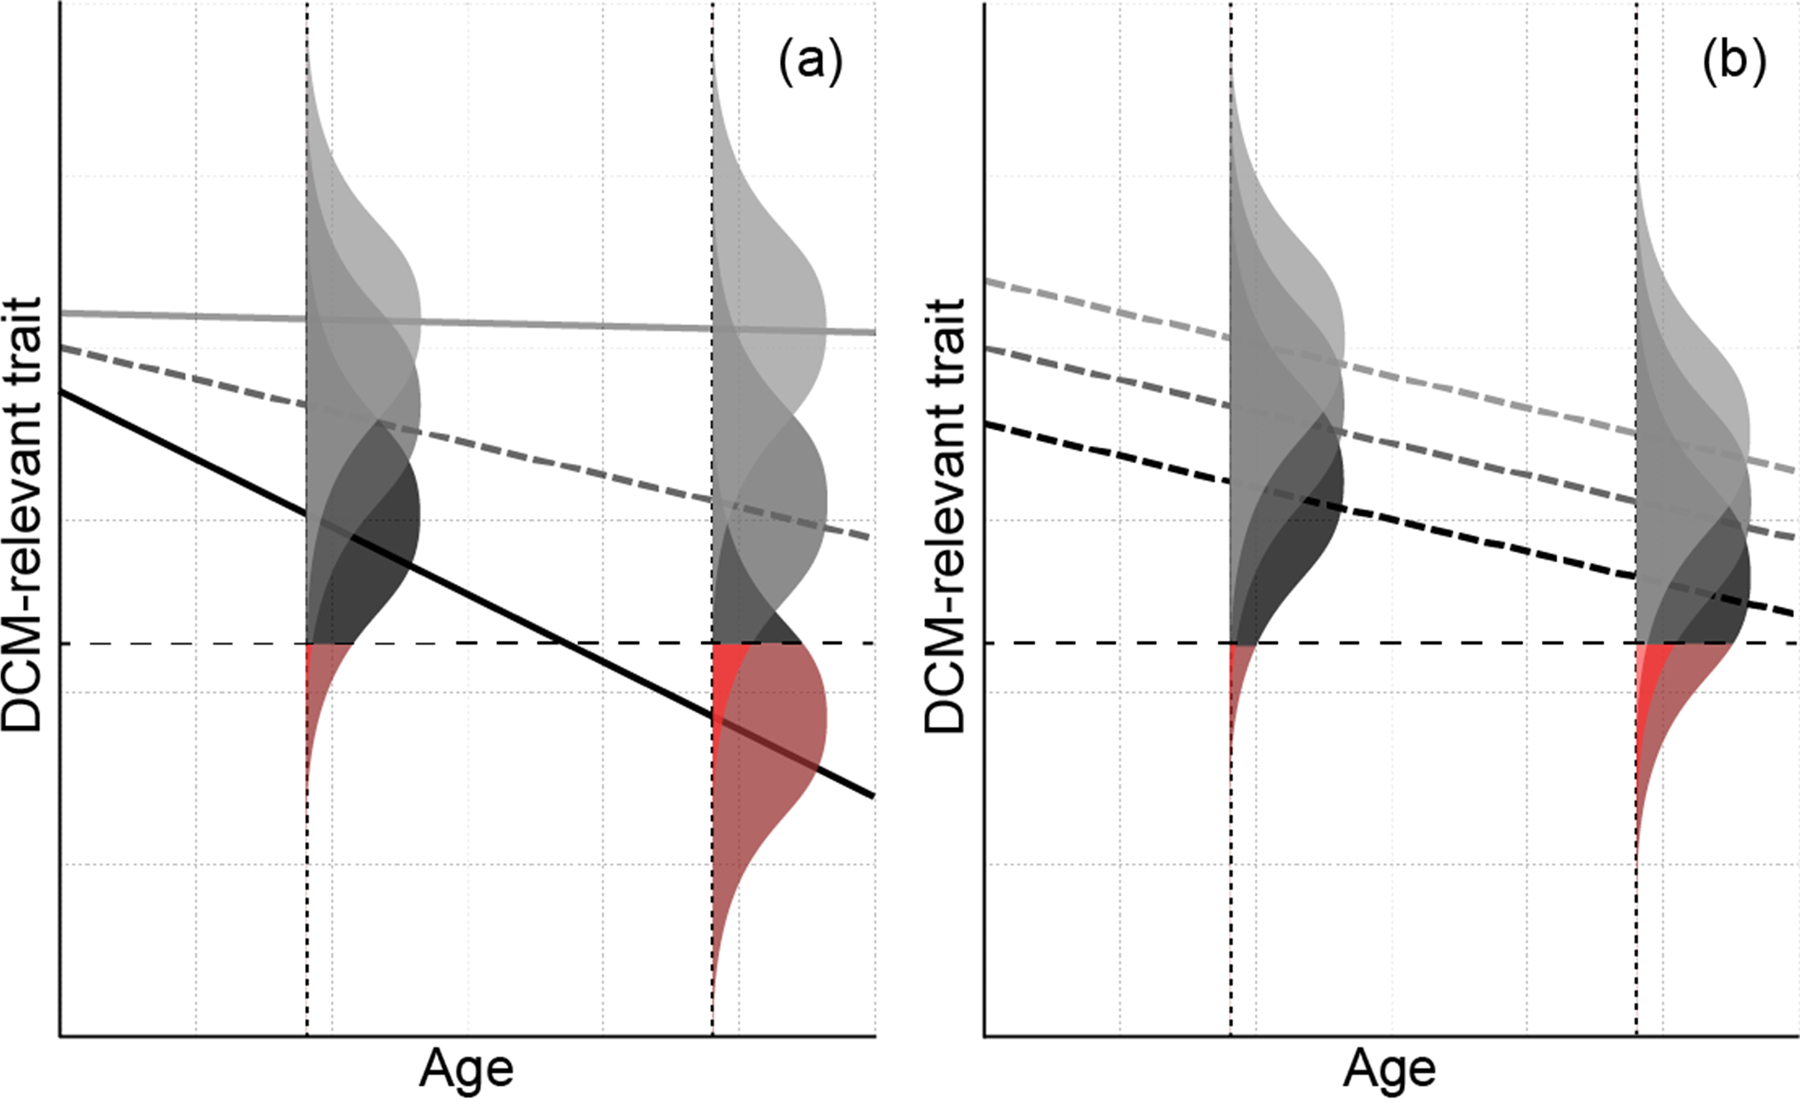
Lines denote the mean quantitative trait measurement (vertical axis) as a function of age (horizontal axis) in individuals with a particular genetic background. The distribution of the actual measurements in these individuals at a particular age arising from non-genetic variation is represented by the shaded bell curve centered on the mean for that age. The dashed horizontal line indicates the threshold below which an individual is considered to have DCM; the amount of total area in each bell curve shaded red indicates risk of DCM. Panel (a) illustrates how the number, or burden, of deleterious rare variants might impact the age trajectory with other factors held fixed. In the absence of such variants (light gray), neither the mean nor risk changes appreciably with age. While all groups have similar means at birth, individuals with higher burdens of deleterious rare variants (denoted by darker lines) have more rapid declines in the mean quantitative trait with age, which result in greater risk and more severe phenotypes, on average, at a given age as well as earlier onset. Panel (b) illustrates how polygenic effects arising from common variants might modify the average trajectory for the rare variant burden in the dashed middle curve from panel (a). In this example, the polygenic effect shifts the entire age trajectory up or down, either nearly eliminating the increased risk due to the rare variant burden (light gray) or exacerbating it (black). More complex descriptions of the age trajectory as a function of rare variants, common variants, and non-genetic factors are possible under this model; this example serves primarily to demonstrate that even a simple multifactorial model involving multiple genetic components can explain empirically observed age-dependent penetrance and variable expressivity.