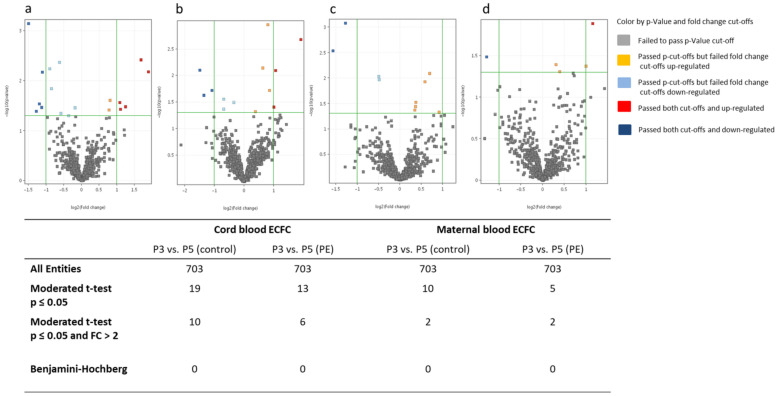
Figure 3.
Significantly regulated miRNAs in ECFC of P3 vs. P5. Volcano plot shows the fold changes of miRNAs on the x-axis and the statistical significance on the y-axis in relation to the reference group. Control: healthy pregnancy; PE: preeclamptic pregnancy; P3: passage 3; P5: passage 5; n = 6 in each group. (a) P3 vs. P5 in control cord blood ECFC. (b) P3 vs. P5 in PE cord blood ECFC. (c) P3 vs. P5 in control maternal blood ECFC. (d) P3 vs. P5 in PE maternal blood ECFC.

