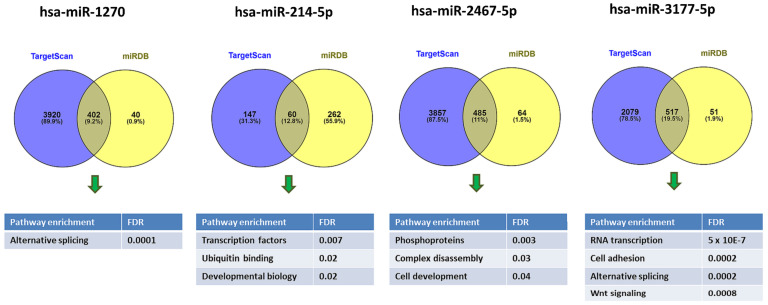
Figure 6.
Venn diagram showing the overlap between predicted targets for hsa-miR-1270, hsa-miR-3177-5p, hsa-miR-214-5p, and hsa-miR-2467-5p that were shared by both TargetScan and miRDB prediction tools and were fed into further pathway analyses. Figure generated using Venny 2.1.0 (http://bioinfogp.cnb.csic.es/tools/venny (accessed on 24 July 2019)).

