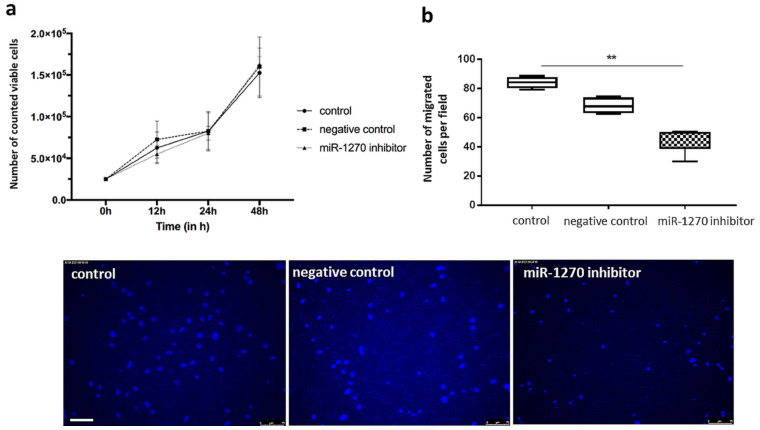
Figure 8.
Proliferation (a) and chemotactic motility (b) of ECFC after inhibition of hsa-miR-1270 compared with negative control. Proliferation: Numbers of counted viable cells at 12, 24, and 48 h; n = 4 per group. Chemotactic motility: Numbers of DAPI-stained migrated cells per area were counted in 5 randomly taken pictures from two different biological replicates. Experiments were performed in at least 2–3 technical replicates; ** p < 0.01. Scale = 75 µm.

