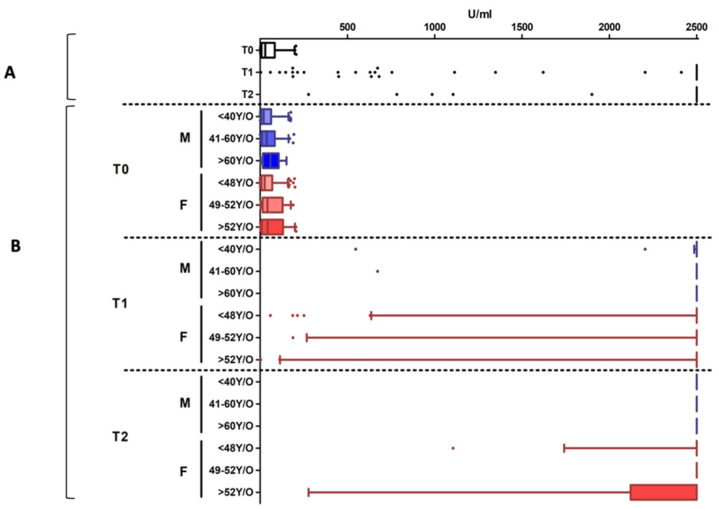
Figure 2.
Antibody titers detected in the population with the natural immunity to SARS-CoV-2. Panel (A): the data are aggregated. Panel (B): disaggregated data by sex (Females: F, in red; Males: M, in blue) and age groups. Individual dots represent outliers. In this population, a high reaction after both vaccine doses is detected, without differences in age and sex groups.

