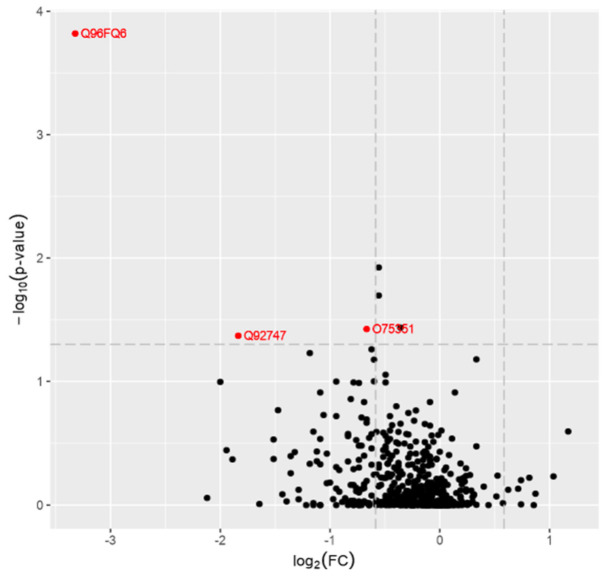
Figure 2.
A volcano plot from the mass spectrometry data is shown. The x-axis shows the fold change values and the y axis shows the −log10 p-values showing statistical significance. Q96FQ6–S100A16 protein; Q92747–ARPC1A protein; O75351–VPS4B protein. The horizontal dashed line shows where p = 0.05 (−log10(0.05)~ = 1.3) is, while the vertical dashed line shows where the fold change is 1.5 (log2 (1.5)~ = 0.58). The absolute 1.5-fold change and p-value of 0.05 are used as the threshold cutoff.

