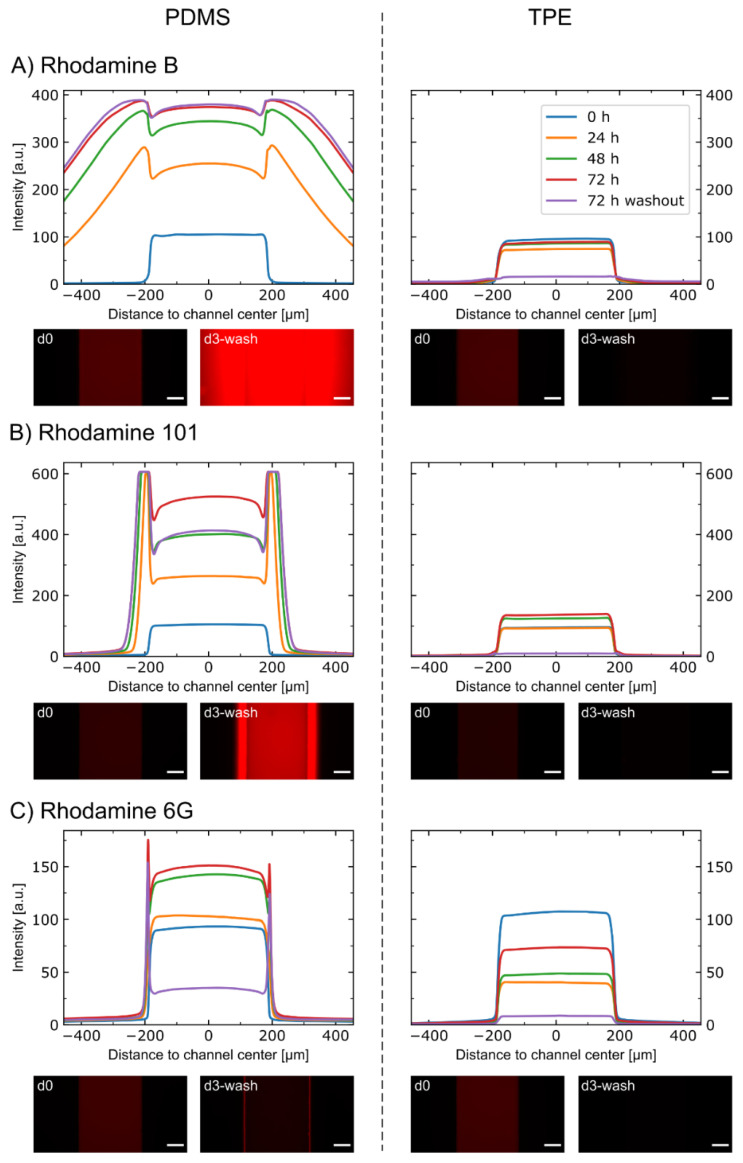
Figure 3.
Absorption of rhodamine molecules into PDMS-based and TPE-based microfluidic devices. Average intensity profiles at different time points for chips incubated with (A) rhodamine B, (B) rhodamine 101, and (C) rhodamine 6G solutions. After 72 h of incubation, the solutions were washed out, and the remnant profile was acquired. Micrographs of the channels from day 0 (d0) and from day 3, after washout (d3-wash) are also shown. The scale bars refer to 100 µm. N = 2 for PDMS-rhodamine 6G 72 h and 72 h washout. All others are N = 3.

