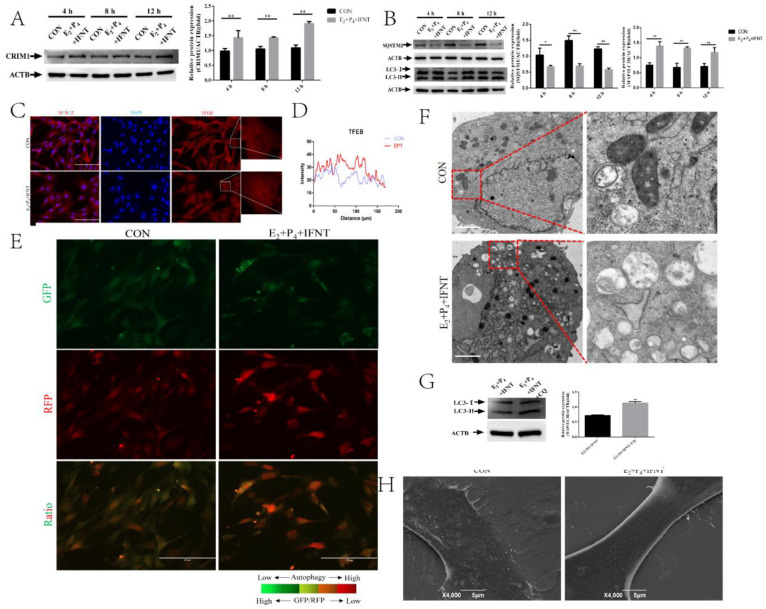
Figure 1.
Hormones and IFN-τ treatment increased CRIM1 and activated autophagy. (A,B) After being treated with or without P4, E2 and IFN-τ, total proteins from EECs were subjected to Western blotting. (C,D) Fluorescence microscopy images of TFEB expression in EECs and histograms of fluorescence intensity. Representative images of three independent experiments are shown. Scale bar = 100 μm. (E) The GFP/RFP fluorescence ratio images of EECs with or without P4, E2 and IFN-τ treatment are shown. (F) EECs were treated with or without P4, E2 and IFN-τ for 12 h. The EECs were fixed and processed for TEM analysis. Scale bar = 2 μm. (G) After being pre-treated with or without CQ, total proteins from EECs were subjected to Western blotting. (H) Scanning electron microscopy (SEM) of EECs, which were treated with or without P4 and E2 followed by IFNT incubation for 12 h. The data are presented as the means ± SEM of three independent experiments. * Significant difference (p < 0.05) compared with other groups; ** Significant difference (p < 0.01) compared with other groups.

