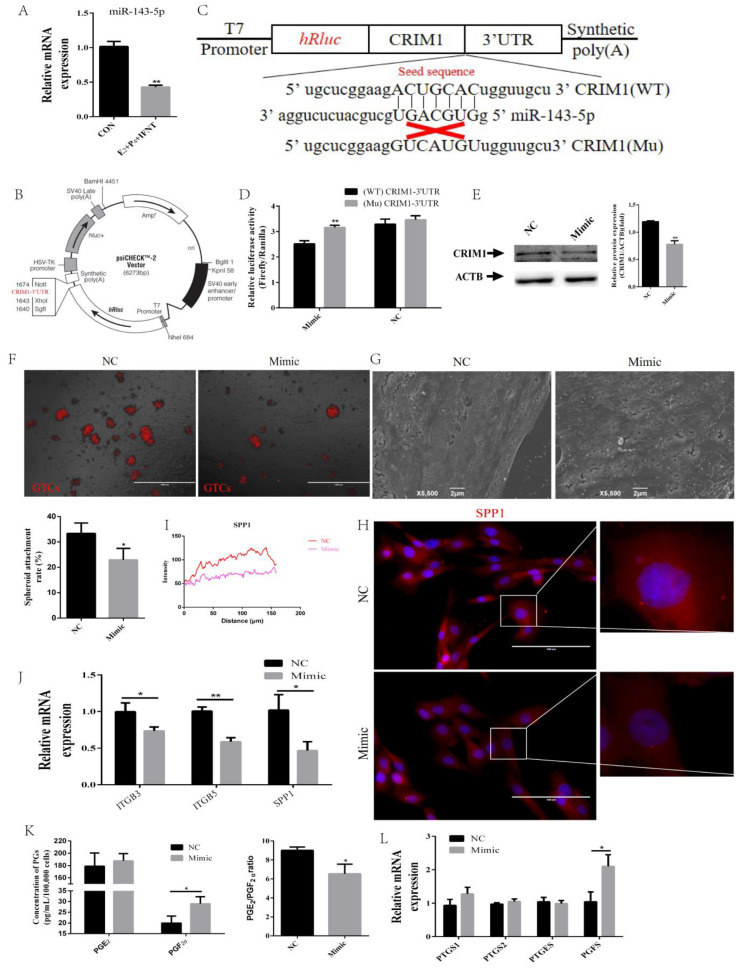
Figure 6.
miR-143-5p targeted the CRIM1 3′UTR to regulate endometrial receptivity. (A) The effect of P4, E2 and IFN-τ on the expression levels of miR-143-5p. (B) The psiCHECKTM-2 vector map and the insertion site of CRIM1-3′UTR are marked in red. (C) Schematic diagram illustrating the design of luciferase reporters with the WT-CRIM1 3′ UTR (WT-CRIM1) or the site-directed mutant CRIM1 3′ UTR (Mu-CRIM1). The nucleotides in red represent the “seed sequence” of miR-143-5p. (D) The luciferase activity was measured by the dual-luciferase reporter assay system. (E) The protein level of CRIM1 was measured by Western blot. (F) GTC spheroids were prepared and the spheroid attachment rate was measured. Representative images of three independent experiments are shown. Scale bar = 1000 μm. (G) The NC and mimic groups were treated with P4, E2 and IFN-τ for 12 h. The EECs were fixed and processed for SEM analysis. (H,I) Fluorescence microscopy images of SPP1 expression in EECs and curves of fluorescence intensity. Representative images of three independent experiments are shown. Scale bar = 100 μm. (J) The cell adhesion molecules were measured by real-time quantitative PCR. (K) The secretion levels of PGE2 and PGF2α were measured in EECs using an ELISA kit. (L) The rate-limiting enzymes of synthesized PGs were measured by real-time quantitative PCR. The data are presented as the means ± SEM of three independent experiments. * Significant difference (p < 0.05) compared with other groups; ** Significant difference (p < 0.01) compared with other groups.

