Fig 1.

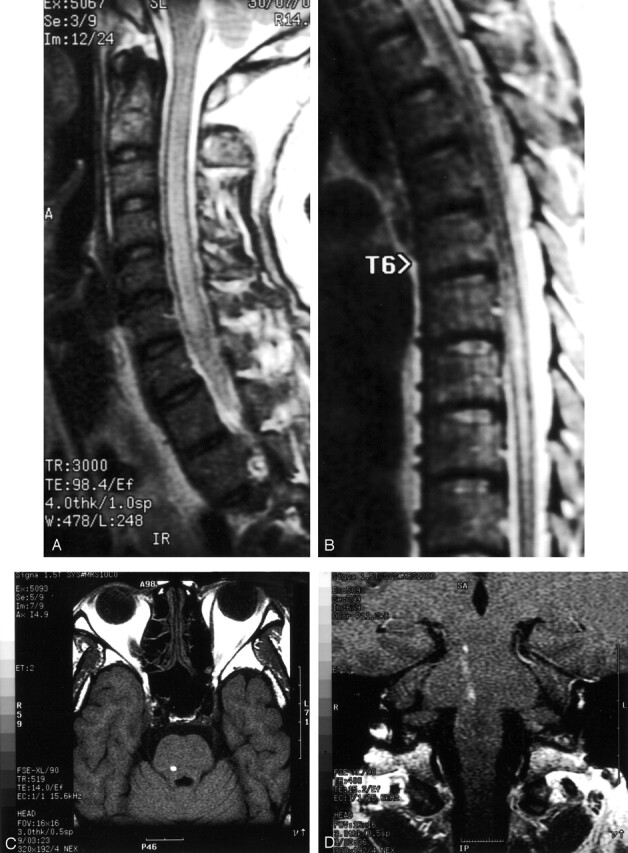
Case 1. MR images of spinal cord and brain.
A and B, Sagittal T2-weighted images, showing diffuse cord enlargement with abnormal high signal intensities.
C, Axial T1-weighted image, showing hemorrhagic spot at posterior midpons.
D, Coronal T1-weighted postgadolinium image, showing hemorrhagic tract at posterior midpons level.
