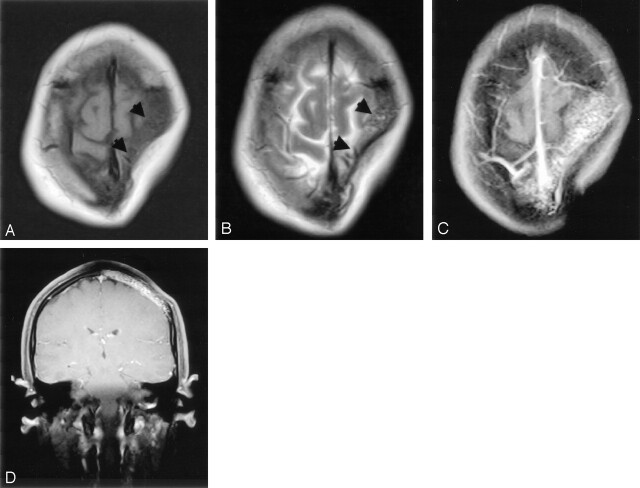
Fig 2.
A, Axial spin-echo T1-weighted (TR/TE/NEX: 402/12.1/3) and B, T2-weighted (4275/96/3) MR images show a focal scalp depression with loss of subjacent calvarial marrow signal intensity (arrowheads). C and D, Axial and coronal contrast-enhanced fat-saturated T1-weighted images obtained at the margins of the skull defect show reticular-pattern of enhancement.

