
Fig 3.
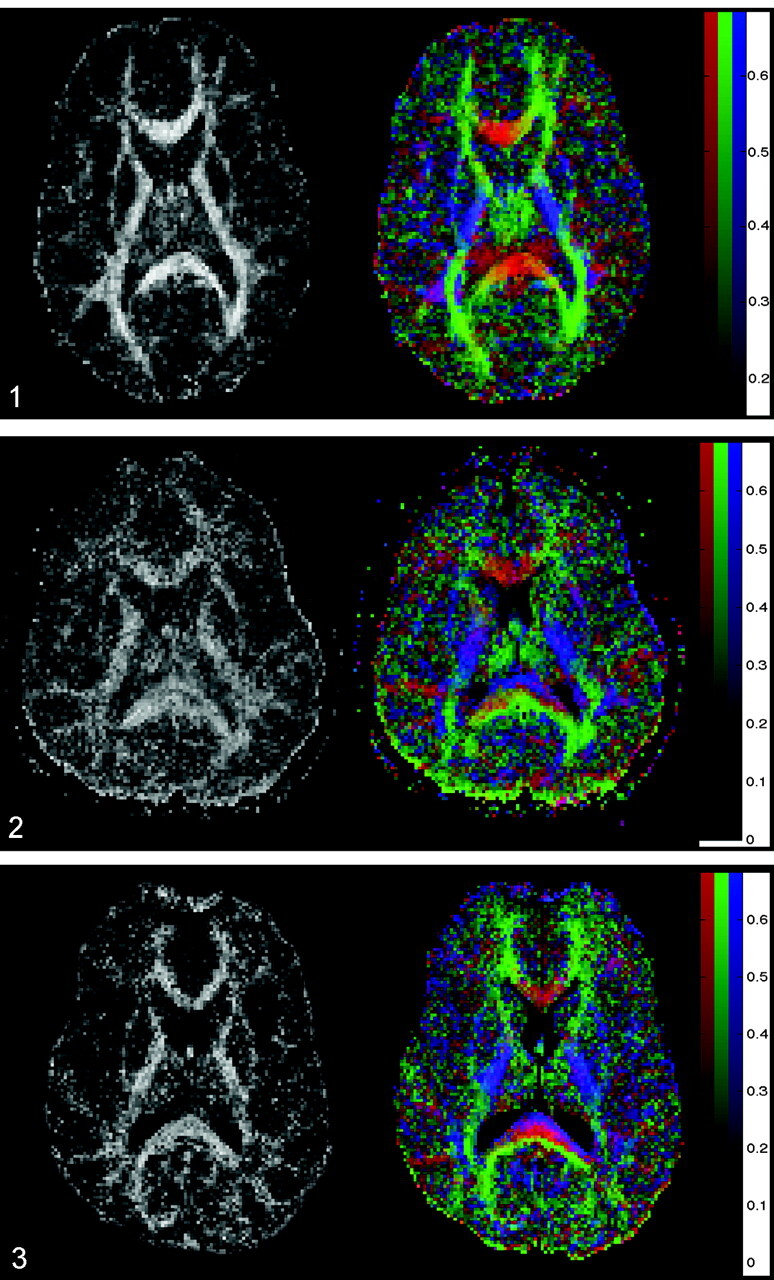
Images in a 37-year-old man with severe TBI. His GCS score at the time of MR imaging was 3, and his Rankin score at discharge was 4. Left, FA map shows a reduced FA index of the corpus callosum (FA = 0.634 ± 0.036). Right, Color-coded map shows a layered blue, red, and green aspect of the splenium of the corpus callosum. This could indicate a partial, selective injury of the most anterior and posterior left-right-left fiber tracts.