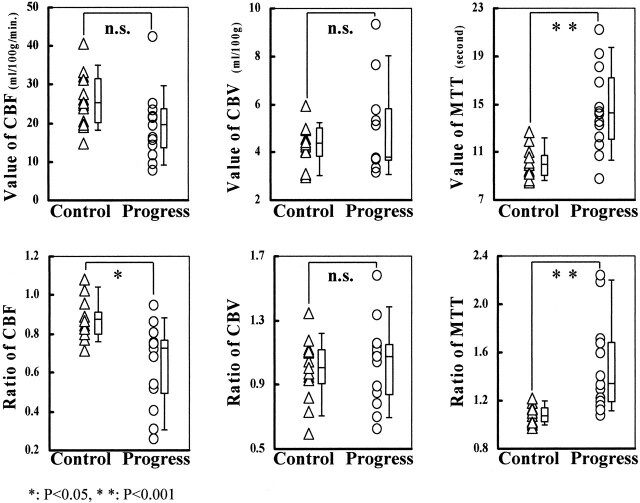
Fig 3.
Comparison of CBF, CBV, and MTT in control and progress groups. Significant difference was shown in MTT value between the two groups (P < .001) but not in CBF value (P = .052) or CBV value (P = .349) in region of interest 1. Significant differences were shown between the two groups in CBF ratio (P = .016) and MTT ratio (P < .001) but not in CBV ratio (P = .695). n.s., not significant.

