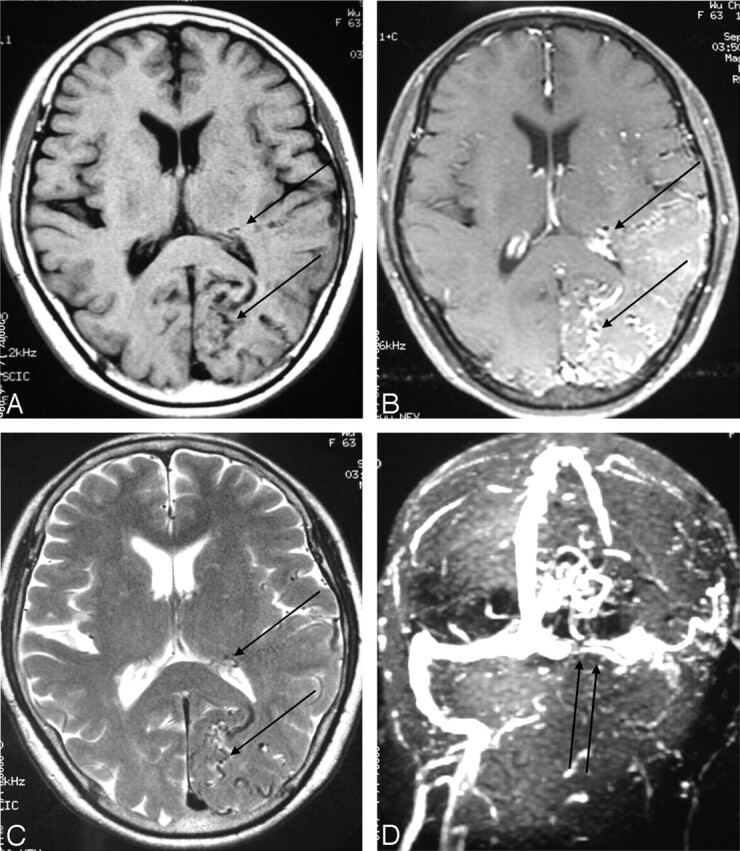
Fig 2.

Axial section of brain.
A and B, Pre- and postgadolinium enhancing T1-weighted image (TR/TE/NEX/Matrix, 500/19/2/256 × 256).
C, T2-weighted image (3,200/106/1/256 × 256).
D, MR venography (TR/TE/flip angle, 26/5/20). Multiple tortuous, enhanced cortical and intramedullary vessels (single arrows) were noted over left temporal and occipital region with left transverse sinus occlusion (double arrows).
