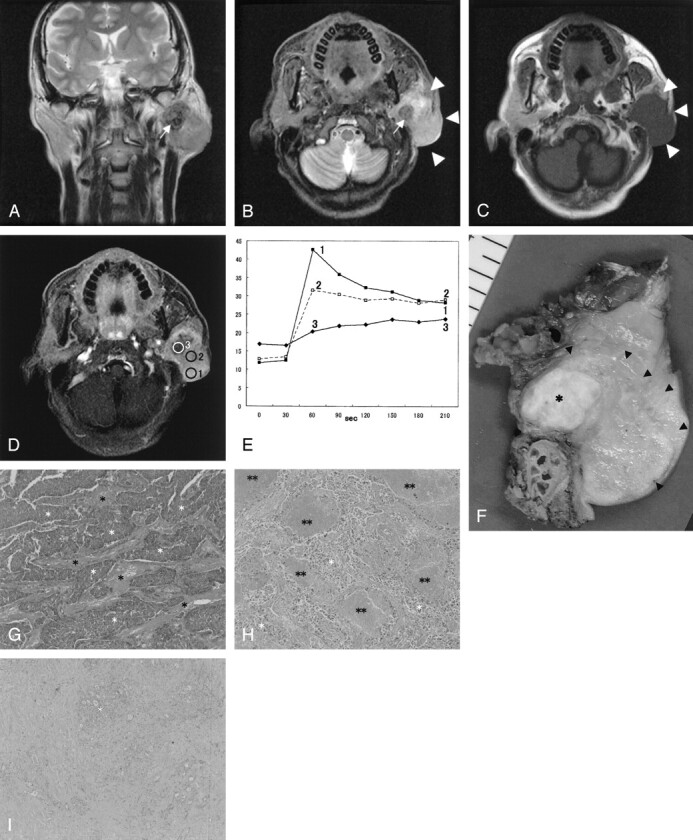
Fig 1.

SDC in the left parotid gland of a 48-year-old man.
A, T2-weighted image (4000/104 [TR/TE], coronal plane) shows a tumor with ill-defined margin. The tumor shows low (arrow) to moderately high signal intensity for the contralateral parotid gland.
B, STIR image (4000/30, axial plane) also shows a hypointensity focus (arrow) in the tumor. The border of the tumor is invasive (arrowheads).
C, T1-weighted image (400/9, axial plane) shows an isointense tumor.
D, Third phase images on dynamic study (6.3/1.4, axial plane) show irregular enhancement. Marked enhanced area (region of interest 1), well-enhanced area (region of interest 2), and gradual upward enhanced area (region of interest 3) are detected.
E, Signal intensity graph shows that the washout ratio of region of interest 1 is 35% (type A) and that of region of interest 2 is 13% (type B). Time–signal intensity curves of region of interest 3 show gradual upward enhancement (type C).
F, Radical parotidectomy including facial nerve, mastoid tip, and skin was performed. Tumor extension from the cut specimen (arrowheads) is in good agreement with the MR images. The focus showing hypointensity on STIR and T2-weighted images and gradual upward enhancement on dynamic MR images corresponding to the fibrotic area (asterisk).
G, The light-optic appearance (original magnification ×40) in region of interest 1 shows abundant atypical epithelial cells (white asterisks) with fibrotic stromata (black asterisks).
H, The light-optic appearance (original magnification ×40) in region of interest 2 shows atypical epithelial cells (white asterisks) with fibrotic stromata and many foci of comedonecrosis (double asterisks).
I, The light-optic appearance (original magnification ×40) in region of interest 3 shows dense fibrotic tissue with cellular components (white asterisk).
