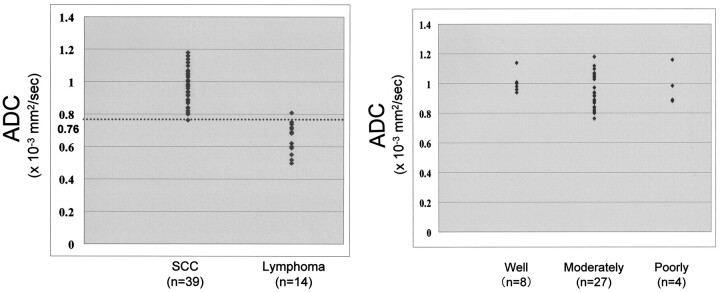
Fig 6.
Scatterplot of ADC values in SCC (n = 39) and lymphoma (n = 14). All but one of the patients with lymphoma had ADCs lower than the lowest ADC (0.76 × 10⁻³ mm2/s) in those with SCC. When an ADC of 0.76 × 10⁻³ mm2/s (dotted line) was used to distinguish between SCC and lymphoma, the accuracy was 98% (52 of 53 lesions).

