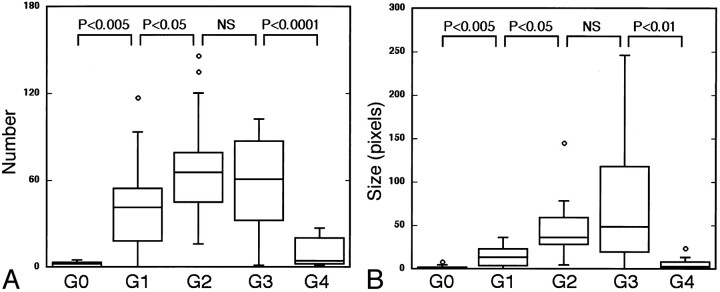
Fig 7.
MR sialographic features are not correlative to conventional sialographic features in the end stages of the disease. The horizontal bar indicates mean; small circles, outliers.
A and B, Graphs show the relationship between the number of sialoectatic foci (A) and the size of sialoectatic foci (B) on MR sialograms and the grades (G0–G4) with conventional sialography. Note the poor correlations between these two sialographic features at grades 3 and 4. NS indicates not significant.

