
Fig 1.
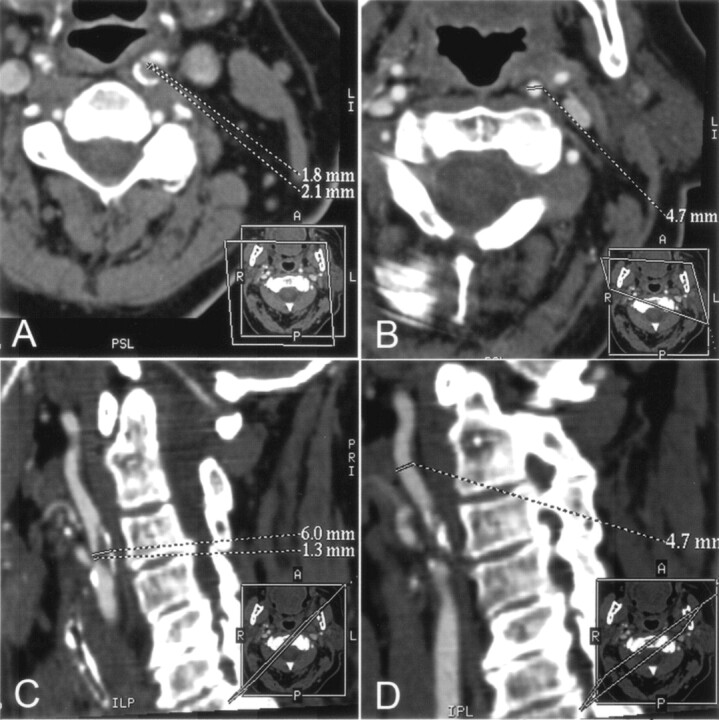
A–D, CT angiographic MPR images of the left ICA at the stenosis level (A and C) and at the distal extracranial ICA as the chosen reference level (B and D) for assessment of stenosis degree with NASCET criteria. Dotted lines indicate sites of measurement of vessel diameter. Every view was tilted according to the patient’s individual anatomy; the tilted planes are shown in small boxes in the right lower corner of each image.
A and B, Cross-sectional MPR images (data were reformatted with the double oblique mode) illustrate the accurate cross-section of the artery at the stenosis level (A) and at the chosen reference level (B). At the stenosis level, the minimum diameter was determined with an additional measurement perpendicular to the smallest diameter.
C and D, Oblique sagittal MPR images tilted along the course of the obliquely oriented ICA at the level of stenosis (C) and at the chosen reference level in the distal extracranial ICA (D) . At the stenosis level, the actual diameter of the entire ICA (upper dotted line in C), including the patent vessel lumen and the plaque, is shown.