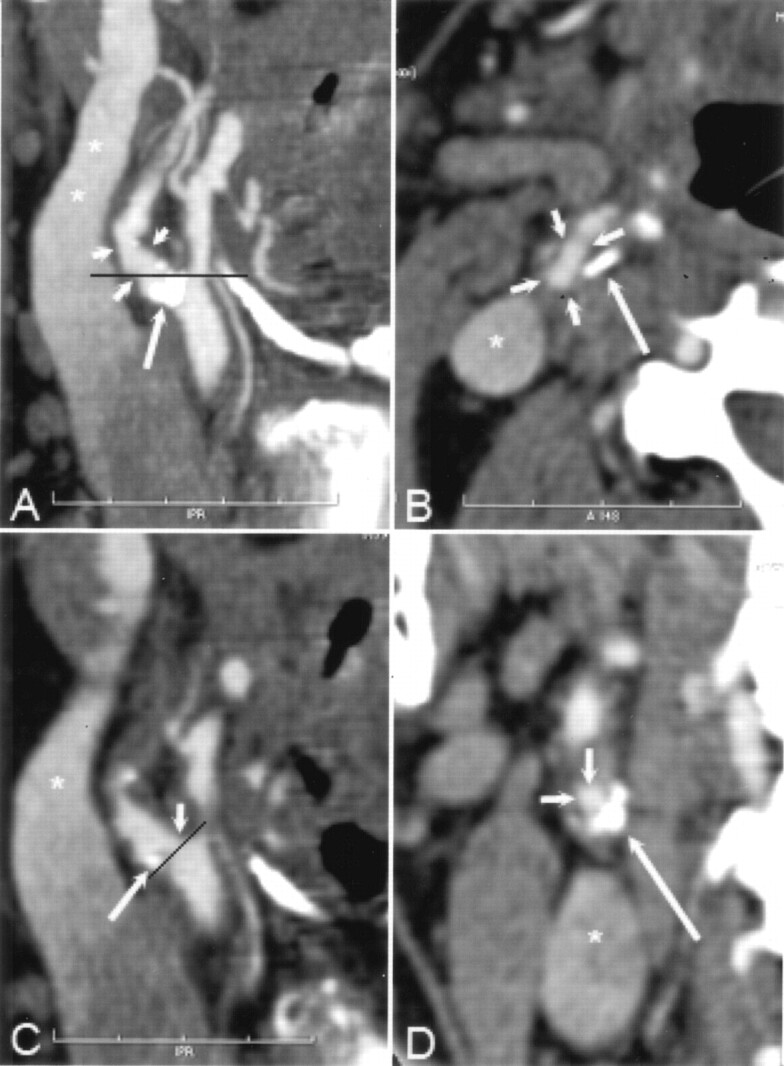
Fig 2.

A and B, CT angiographic thin-slab MIP images with slab thickness of 6 mm in the right carotid artery reveals atherosclerotic changes (short arrows in A) and an extensive mural calcification (long arrow in A and B) in the bulbar area of the ICA. The black line in A indicates the corresponding axial plane in B. Note that the course of the ICA seen entirely on the MIP image deflects from the caudocranial scanning plane. Therefore, the cross-section of the ICA (short arrows in B) is elongated. Asterisk indicates partly enhanced jugular vein.
C, Oblique sagittal MPR image with section thickness of 0.3 mm shows that the hemodynamically insignificant stenosis (short arrow) is seen next to the mural calcification (long arrow), which hides the stenosis area seen on the MIP image in A. Black line indicates the orientation of the cross-sectional MPR image in D; asterisk indicates partly enhanced jugular vein.
D, Cross-sectional MRP image shows a concentric plaque in the ICA wall with eccentrically located extensive mural calcification (long arrow), and the enhanced lumen (short arrows) appears circular. Asterisk indicates partly enhanced jugular vein. According to our experience, it was slightly easier to determine the maximal stenosis point of the carotid artery with cross-sectional MPR than with sagittal MPR mode. With sagittal MPR mode, it is possible to rotate the image plane 360°, leading to inaccuracy in detecting the shortest diameter in eccentric stenoses. In addition, during the procedure to produce the MPR images at the GE workstation, there is a mark point on the target vessel (not shown) that sometimes hampers visualization of the stenosed carotid artery, especially with sagittal MPR mode.
