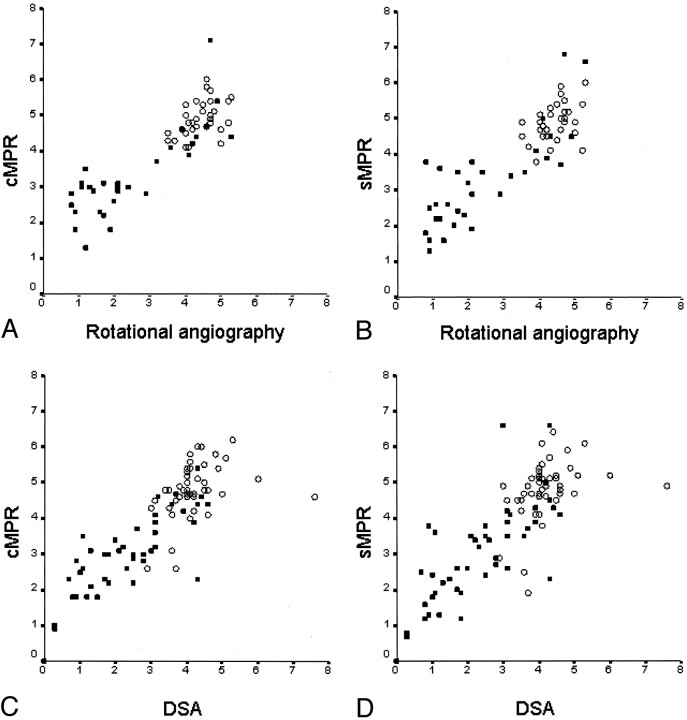
Fig 4.
A–D, Scatterplots show the distribution of absolute diameters in millimeters between rotational angiography and cross-sectional MRP (cMPR) (A) and oblique sagittal MPR (sMPR) (B) of CT angiography and between DSA and cross-sectional MPR (C) and oblique sagittal MPR (D) of CT angiography. The absolute diameter measurements were obtained from the stenosed level (filled square) and from the reference level (open circle).

