Figure 1.
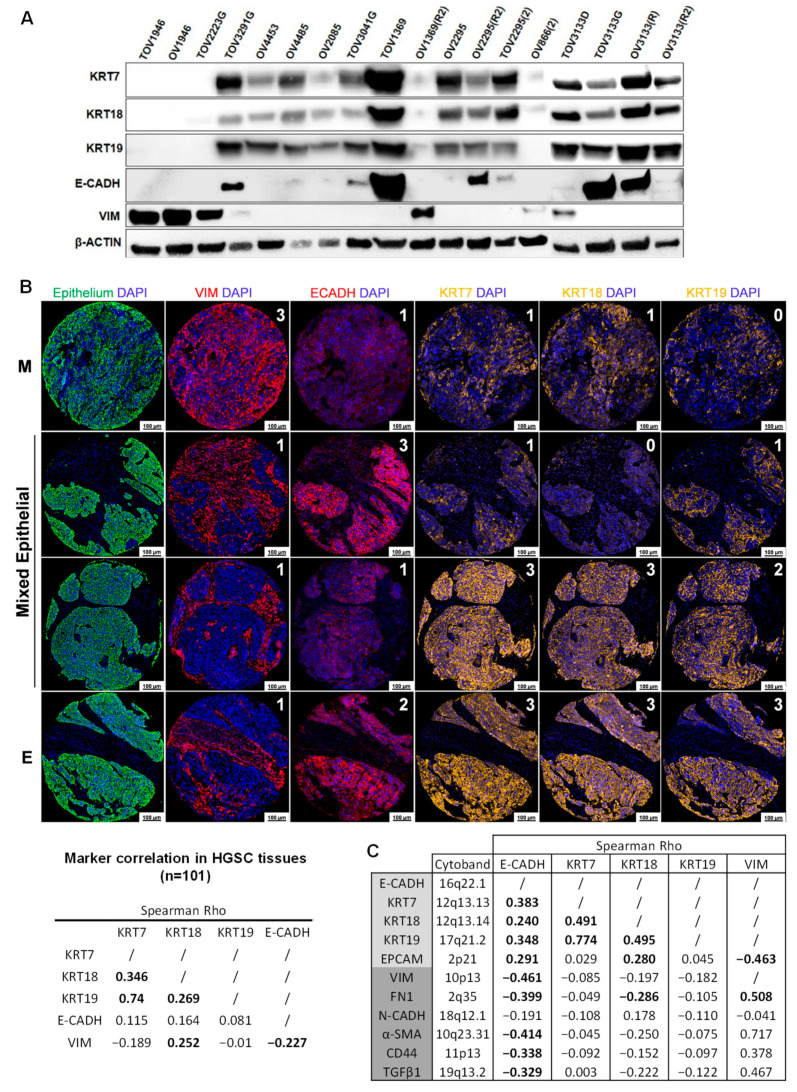
HGSC cell lines and tissues display a high variability in epithelial marker expression. (A) E-CADH, KRT7, KRT18, KRT19, and VIM protein expression was observed by Western blot in 18 HGSC cell lines. β-actin was used as normalization control. (B) KRT7, KRT18, KRT19, E-CADH, and VIM protein expression was observed by immunofluorescence in a TMA comprised of 101 HGSC tissues. Mean fluorescence intensity (MFI) of markers was quantified in the epithelium following digital image analysis. MFI were categorized into 4 groups of expression: 0 (negative), 1 (low), 2 (moderate), and 3 (high), using 25th, 50th and 75th percentiles, respectively, as cut-offs between groups. Spearman Rho correlations between marker expression are indicated in the table. M: Mesenchymal-like phenotype, E: Epithelial-like phenotype. (C) Spearman Rho correlations between KRT7, KRT18, KRT19, E-CADH, VIM, and EMT markers were obtained from protein expression measured by the CPTAC (mass spectrometry) on 274 HGSC cases extracted from TCGA (Ovarian Serous Cystadenocarcinoma dataset). Epithelial markers are highlighted in light grey and mesenchymal markers are highlighted in dark grey. Significant correlations are shown in bold (p < 0.05).

