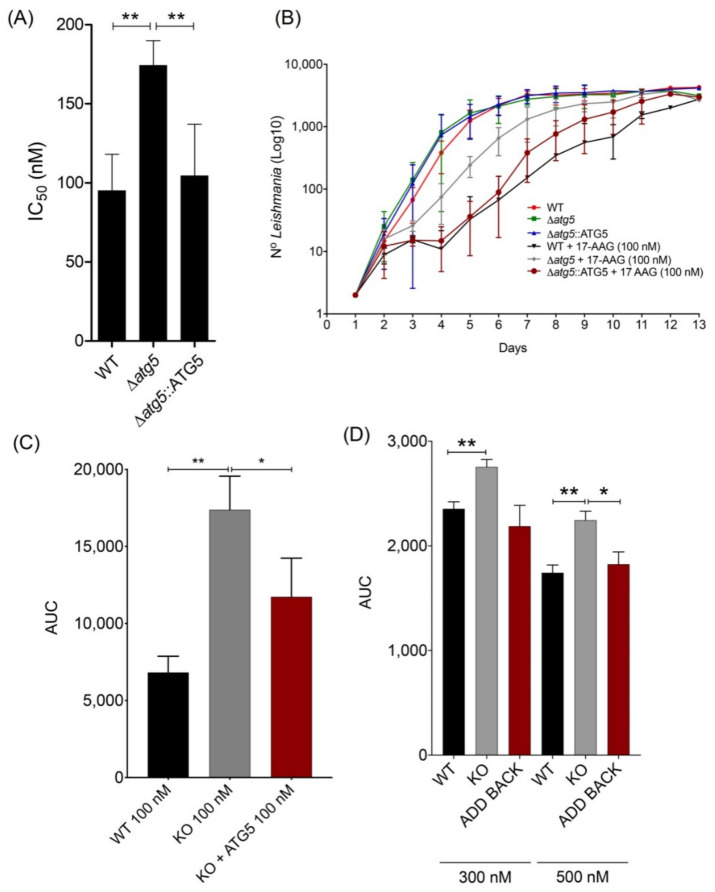
Figure 3.
Effect of 17-AAG on survival and replication of WT, Δatg5 and Δatg5::ATG5 Leishmania. (A) IC50 values for 17-AAG in different Leishmania lineages. Bars represent mean ± SD from four independent experiments (One-way ANOVA, Tukey’s multiple comparisons test, ** p < 0.01). (B) Growth curve reflecting 13 day-counts of WT, Δatg5 and Δatg5::ATG5 parasites, treated or not with 17-AAG at 100 nM. Symbols are representative of means ± SD from three independent experiments. (C) Area under the curve (AUC) analysis of WT, Δatg5 and Δatg5::ATG5 growth depicted in panel (B), following treatment with 17-AAG. Bars represent mean ± SD from three independent experiments (one-way ANOVA test, Tukey’s multiple comparison test * p = 0.0321 0.05, ** p = 0.0016). (D) AUC analysis of WT, Δatg5 and Δatg5::ATG5 viability following treatment with 17-AAG at 300 nM and 500 nM for 24 h, 48 h and 72 h. Bars represent mean ± SD of a single experiment performed in quadruplicate (Welch’s ANOVA test, Dunnett’s T3 multiple comparison test * p < 0.05, ** p < 0.01).

