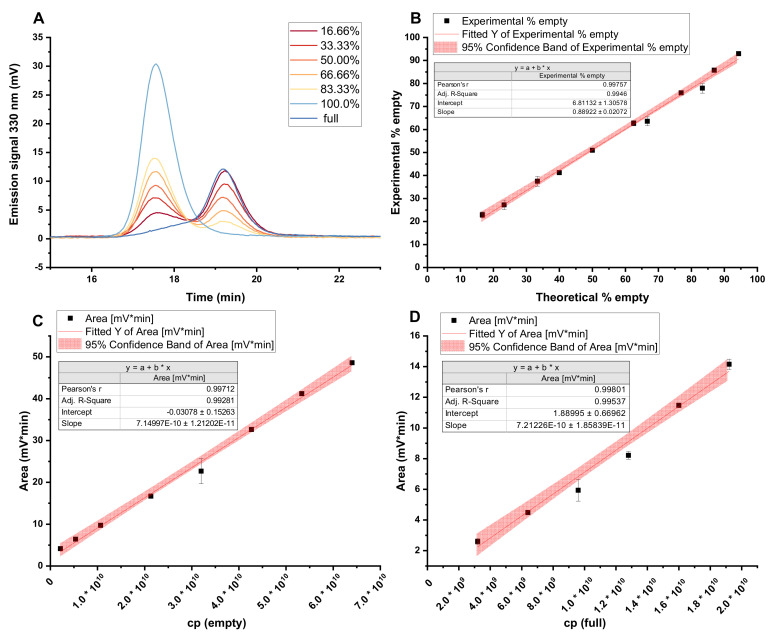
Figure A1.
Calibration data of the Protein-Pak Hi Res Q, 5 µm, 4.6 × 100 mm. (A) Depiction of the raw data of the chromatograms showing the amount of empty capsids in percent. (B) Experimentally determined percentage values of empty capsids plotted against the theoretical percentage. (C,D) Calibrations of empty capsid (C) and full rAAV (D) titers.

