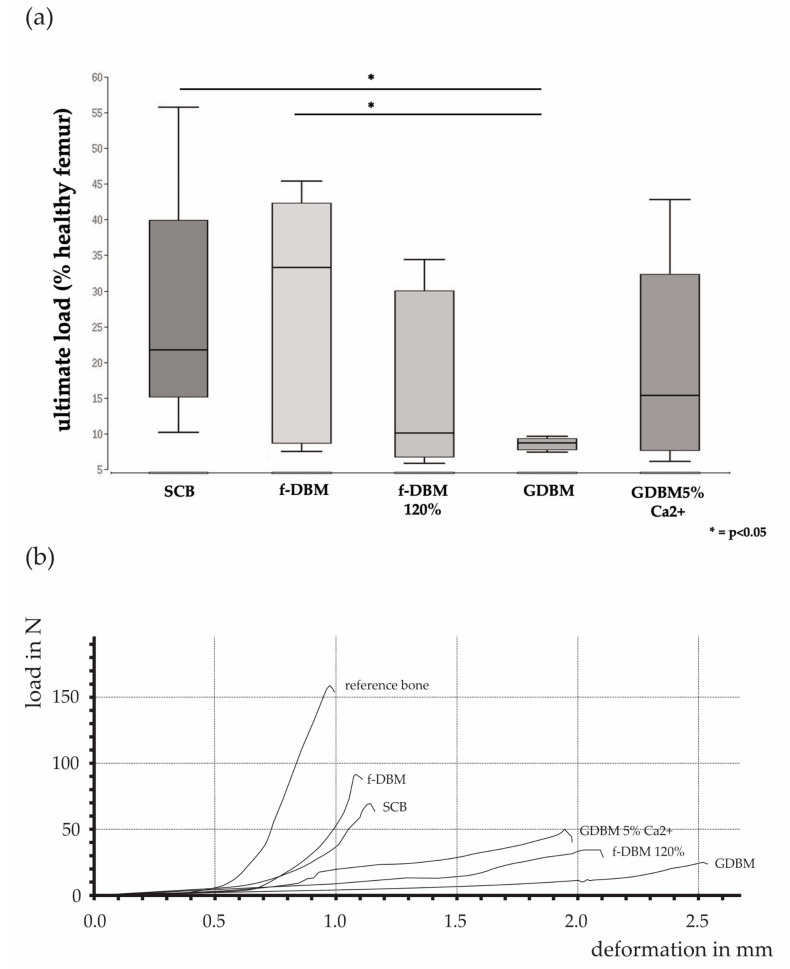
Figure 2.
Ultimate load of the 5 mm bone defect, in relation to the contralateral healthy femur (= 100%). The percentage of ultimate load as percentage of the healthy contralateral femur was significantly lower in the GDBM group than in the SCB group and the f-DBM group. No significant differences between the fiber groups and no significant differences between the fiber groups and the SCB group (a). Selected force curves of the different groups show the deformation in mm per load in newtons (b).

